Content
Published:
This is an archived release.
New calculations gave lower emissions
New emission calculations for greenhouse gases in Norway show a 10 per cent growth from 1990 to 2004. The preliminary figures for the same period presented last year showed 11 per cent growth.
The calculations were carried out by Statistics Norway and the Norwegian Pollution Control Authority.
Lower greenhouse gas emissions than previously calculated
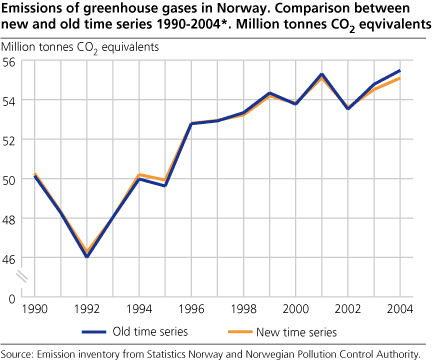
Implementation of new methods in the emission inventory for the whole period 1990-2004 resulted in lower total emissions and, in addition, showed that the reduction during the latest years of the period was higher than in the base year 1990. The new calculations show that the total greenhouse gas emissions rose by 10 per cent from the 1990 level. This is somewhat lower than shown in the calculations presented in April 2005.
In 2005, the work with an improved emission inventory has been given high priority, since Norway's permitted emissions in the Kyoto period (2008-2012) is to be determined in the course of 2006. Statistics Norway and the Norwegian Pollution Control Authority are still working with the new calculations, and new changes in the historic emissions may still occur during 2006. The emission inventory can also be changed after 2006, but Norway's quota for the period 2008-2012 will be permanently settled ( read more SFT ) .
Norway's emissions of greenhouse gases in 2004 were 55.1 million tonnes CO2 equivalents. This is almost 10 per cent more than in 1990 and slightly over 1 per cent more than in 2003. In the period 2008-2012, the emissions must not be more than 1 per cent above the 1990 level, taking trade with quotas, joint implementation and/or the clean development mechanism into account.
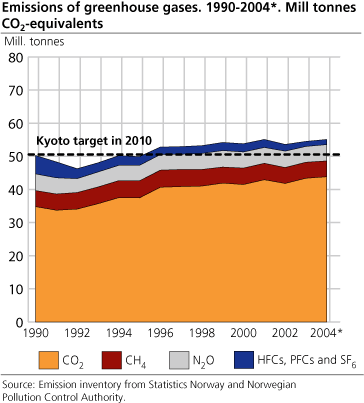
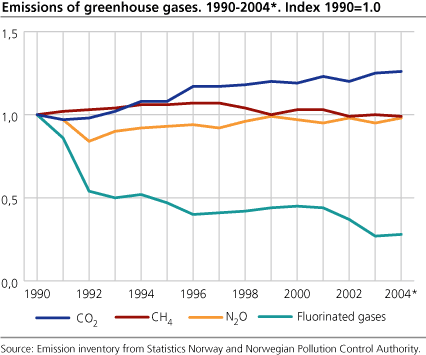
Greenhouse gases include the six gases carbon dioxide (CO2), methane (CH4), nitrous oxide (N2O), hydrofluorocarbons (HFCs), perfluorocarbons (PFCs) and sulphur hexafluoride (SF6) ( read more ). In 2004, CO2 made up almost 80 per cent of the greenhouse gas emissions, and contributed to the greater part of the rise in these emissions in 2004. Since 1990, the CO2 emissions have increased by 26 per cent, while the emissions of fluorinated gases (HFCs, PFCs and SF6) have been reduced by 72 per cent.
Oil and gas extraction and road traffic caused emission growth
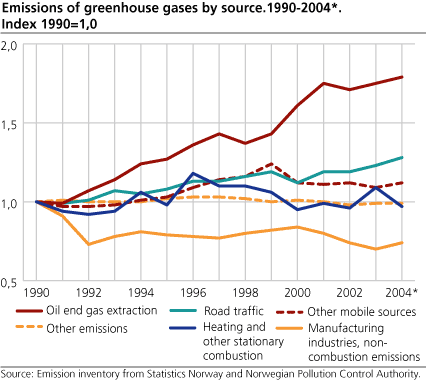
The rise in the greenhouse gas emissions from 1990 to 2004 is dominated by emissions from oil and gas activities, which rose by 79 per cent during the period. Emissions from road traffic increased by 28 per cent in the same period, a growth that is related to higher standard of living and increased economic activity. Higher gas production on the continental shelf resulted in a growth in emissions from this source from 2003 to 2004.
Process emissions from the manufacturing industry are to a high degree dependent on international economy. 2004 was a good year for parts of this industry, and the emissions rose. CO2 emissions from stationary combustion (in manufacturing and other industries and households) were reduced by 11 per cent in 2004. This reduction was probably caused by lower prices of electricity and higher prices of oil products, leading to less use of oil products.
Improved calculation methods
The United Nations' guidelines for how to report emissions say that if new knowledge gives better methods, data sources or emission factors, recalculations shall be carried out for each year in the period.. With the new improved calculations, all figures are recalculated back to 1990.
Because of the quotas in the Kyoto period, this year's calculations are more important than ever. In 2005, the calculation methods for methane emissions from animals, nitrous oxide from road traffic and methane from landfills have been improved. In addition, more reported figures from industrial plants have been used in the model, and this has contributed to more accurate emission figures. The accomplishment of a special project has resulted in better calculations for HFCs and SF6.
From this year onwards, the emission figures for Norway also include Russian activity on Svalbard, and recalculations have been carried out for the years 1990-2004 to include this. Russian activity on Svalbard has been reduced during this period and reduces the rise in the total emissions since 1990.
Emission figures more consistent with the guidelines
The greenhouse gas emissions in Norway's emission inventory are each year controlled by a team from the United Nation Framework Convention on Climate Change (UNFCCC). Some of the performed changes have been suggested by the revision team, others are initiated by Statistics Norway and the Norwegian Pollution Control Authority. All improvements have been carried out for the entire period 1990-2004. Accordingly, the time series presented now differs from those previously released. The changes have resulted in an emission inventory more consistent with the guidelines.
Important changes for methane and nitrous oxide
The changes in methods have resulted in new figures, particularly for the emissions of methane and nitrous oxide. Methane emissions have been adjusted down by 4 per cent in 2004. See article in SSBmagasinet (in Norwegian only). The nitrous oxide emissions are adjusted down by 11 per cent. There are only minor changes for CO2. The gap between 1990 and 2004 for all the six greenhouse gases together has been reduced by 500 000 tonnes CO2 equivalents since the previous calculation.
The main picture is unchanged
Even though the new emission figures are somewhat lower than in the previous calculations, it does not change the fact that Norway must reduce its emissions considerably in the coming years, either by carrying out actual emission reductions or by trading emission units or make use of other Kyoto mechanisms.
Uncertainties
The changes in the figures that are presented now, illustrate that there are great uncertainties connected to the emission figures. An analysis carried out by Statistics Norway in 2000, showed uncertainties at ±20 per cent of the level for a single year and ±4 per cent of the trend 1990-2010. Statistics Norway is now working on a new project to estimate uncertainties in single sources, emission levels and trends.
Quality improvement is driving force
The driving force to make improvements is the hope of being able to produce emission figures of satisfying quality for the United Nation Framework Convention on Climate Change, and to give the government and others a basis for making decisions of what measures to introduce to reduce emissions.
Documentation of the Norwegian emission inventory
A newly published report from Statistics Norway presents a detailed documentation of the Norwegian emission inventory. The report describes methods, activity data, data sources and emission factors. Uncertainties and quality controls are also described. The report will be used as a basis for the annual reports submitted by Norway to the United Nation Framework Convention on Climate Change. The report can be downloaded here .
Other articles published today
Mindre utslipp fra avfallsfyllinger enn tidligere beregnet (in Norwegian only) (9.2.2006)
Norway far from nitrogen target (9.2.2006)
Small changes in heavy metals emissions (9.2.2006)
More figures in StatBank .
In May, preliminary figures for emission of greenhouse gases in 2005 will be published.
Tables:
Contact
-
Trude Melby Bothner
E-mail: trude.melby.bothner@ssb.no
tel.: (+47) 40 81 14 25
-
Berit Storbråten
E-mail: berit.storbraten@ssb.no
tel.: (+47) 40 81 14 23