Content
Published:
This is an archived release.
Weaker Profitability
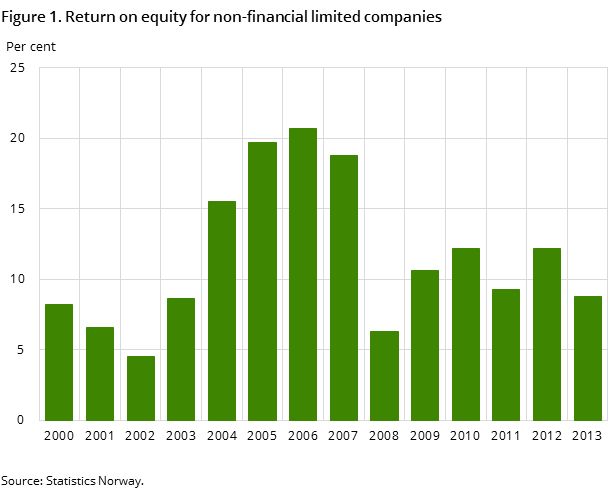
Preliminary figures for non-financial limited companies showed lower profitability in 2013 than in 2012.
| NOK million | Per cent | ||
|---|---|---|---|
| 2013 | 2012 | 2012 - 2013 | |
| Income statement | |||
| Operating income | 4 879 780 | 4 844 104 | 0.7 |
| Operating profit | 586 105 | 604 206 | -3.0 |
| Operating profit before tax | 695 610 | 849 898 | -18.2 |
| Net profit | 405 141 | 499 250 | -18.9 |
| Balance sheet | |||
| Fixed assets | 7 513 052 | 6 993 640 | 7.4 |
| Current assets | 2 760 034 | 2 795 880 | -1.3 |
| Equity | 4 596 006 | 4 030 086 | 14.0 |
| Liabilities | 5 677 064 | 5 759 434 | -1.4 |
| Per cent | Percentage points | ||
| Key figures | |||
| Operating profit margin | 12.0 | 12.5 | -0.5 |
| Return on total assets | 8.1 | 10.2 | -2.1 |
| Return on equity | 8.8 | 12.5 | -3.7 |
| Equity ratio | 44.7 | 41.2 | 3.5 |

The operating profit and net financial items fell, leading to a fall in profit before taxes in 2013. The operating margin was 12 per cent in 2013, down by 0.5 percentage points from 2012. That, coupled with further decrease in net financial items owing to a weaker profit before taxes, resulted in the operating profit margin decreasing by 3.2 percentage points, from 17.5 per cent in 2012 to 14.3 per cent in 2013.
Equity capital for non-financial limited companies increased in 2013. Equity, which is the sum of retained earnings and capital paid by owners, represents the portion of invested capital belonging to owners. Equity paid by owners wen up, while liabilities went down, resulting in a rise in total equity in 2013. Consequently, equity ratio rose from 41.2 percent in 2012 to 44.7 pro sent in 2013.
Changes in the statistical basis Open and readClose
A new institutional sector classification was introduced as from fiscal year 2012, with the result that the figures are not entirely comparable with the figures for previous years. The introduction has affected the demarcation between financial and non-financial enterprises, resulting in enterprises in portfolio investments being moved from non-financial limited companies. Owing to the new sector classification, some changes were made in industrial classification, which may have an impact on the comparability of the figures broken down by industry.
Find more figures
Find detailed figures from Accounting statistics for non-financial limited companies
Contact
-
Mihret Shimay
E-mail: mihret.shimay@ssb.no
tel.: (+47) 94 84 03 94
-
Hieu Minh Tran
E-mail: hieu.tran@ssb.no
tel.: (+47) 46 67 66 50
