Content
Published:
This is an archived release.
Poorest profitability since 2002
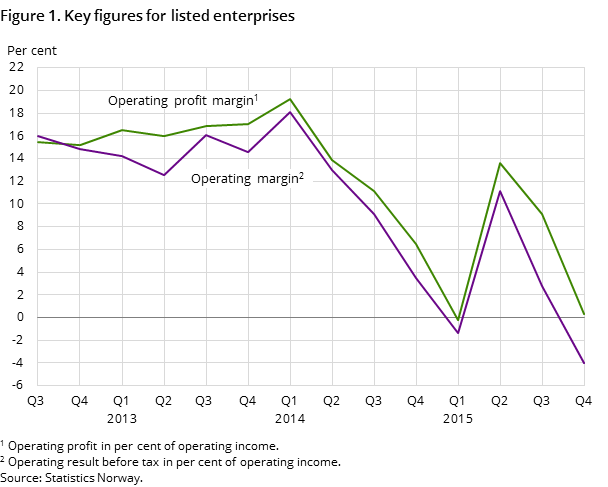
The operating margin for listed enterprises was -4 per cent in the fourth quarter of 2015. This is the weakest listing since the statistics were established in 2002. Operating margin went down 6.8 per cent from the third quarter and 7.5 per cent from the same quarter of 2014.
| NOK Million | Per cent | |||
|---|---|---|---|---|
| 4th quarter 2015 | 3rd quarter 2015 | 3rd quarter 2015 - 4th quarter 2015 | 4th quarter 2014 - 4th quarter 2015 | |
| Income statement | ||||
| Operating income | 348 966 | 342 991 | 1.7 | -11.4 |
| Operating profit | 1 152 | 31 097 | -96.3 | -95.5 |
| Operating result before tax | -13 910 | 9 615 | -244.7 | -200.4 |
| Equity | 969 617 | 976 683 | -0.7 | -0.9 |
| Total equity and liabilities | 2 517 385 | 2 546 992 | -1.2 | 3.4 |
| Per cent | Percentage points | |||
| Key figures | ||||
| Operating profit margin (per cent) | 0.3 | 9.1 | -8.8 | -6.2 |
| Operating margin (per cent) | -4.0 | 2.8 | -6.8 | -7.5 |
| Equity ratio (per cent) | 38.5 | 38.3 | 0.2 | -1.7 |

The listed enterprises had NOK 14 billion pre-tax loss in the last quarter of 2015, which led to the lower operating margin. Operating profit margin was 0.3 per cent, down from 9.1 per cent in the previous quarter and 6.5 per cent in the corresponding quarter of 2014.
Almost 50 per cent of the listed enterprises had a deficit before tax in the last quarter of 2015, and 44 per cent had a negative operating income. The share of enterprises with pre-tax losses was 43 per cent in the corresponding quarter of 2014.
Contact
-
Statistics Norway's Information Centre
E-mail: informasjon@ssb.no
tel.: (+47) 21 09 46 42
