Content
Published:
This is an archived release.
Growth in retail sales of NOK 10 billion
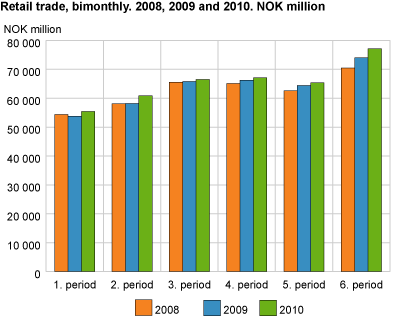
The turnover in retail sales was NOK 392 billion during 2010. This gives a growth of about NOK 10 billion or 2.6 per cent compared to the same period of 2009.
In comparison, the Index of retail sales showed an increase of 2.2 per cent during the same period.
Grocery stores had a turnover of NOK 135 billion in 2010; a growth of NOK 3.4 billion compared to the same period of 2009. Grocery stores hold 35 per cent of the retail trade in Norway.
In November and December 2010, Norwegians went grocery shopping for NOK 29 billion; a growth of more than NOK 800 million or 3 per cent compared to the same period of 2009. Retail trade in Norway had a turnover of a total of NOK 77 billion during November and December 2010.
Trade and repair of motor vehicles
During 2010, the turnover within trade and repair of motor vehicles increased by NOK 23 billion, or 15 per cent, compared to the same period of 2009.
In November and December 2010 the turnover in this industry increased by 14 per cent compared to the same period of 2009.
Wholesale of NOK 772 billion
The turnover in wholesale was NOK 772 billion during 2010. This is an increase of NOK 42 billion or almost 6 per cent compared to the same period of 2009.
In November and December 2010 the growth was nearly 9 per cent compared to the same period of 2009.
The figures do not include value added tax.
Tables:
- Table 1 Sales statistics of retail sales excluding sales of motorized vehicles. Sales exlude VAT Sales, by county
- Table 2 Wholesale and retail trade and repair of motor vehicles and motorcycles. Sales excluding VAT. Sales by county
- Table 3 Wholesale trade and commission trade, except of motor vehicles and motorcycles. Sales exlude VAT Sales by county
- Table 4 Turnover statistics except wholesale on a fee or contract basis 2009. Turnover excluding VAT. NOK million
- Table 5 Turnover statistics except wholesale on a fee or contract basis 2010. Turnover excluding VAT. NOK million
Contact
-
Bestilling av oppdrag
E-mail: varehandel_bestilling@ssb.no
-
Jonas Eid Lauveng
E-mail: jonas.lauveng@ssb.no
tel.: (+47) 40 81 13 95
-
Selma Grønningsæter
E-mail: selma.gronningsaeter@ssb.no
tel.: (+47) 48 17 22 16

