Content
Published:
This is an archived release.
Increased diesel prices in January
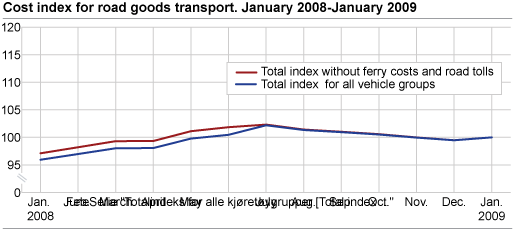
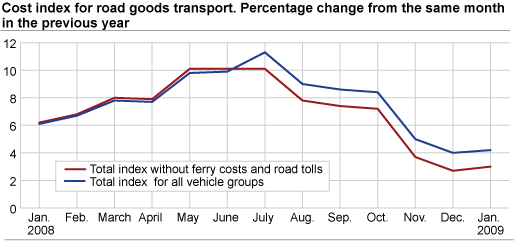
The total cost index for road goods transport increased by 0.5 per cent from December 2008 to January 2009. Over the last twelve months the total costs have increased by 4.2 per cent.
|
In connection with the turn of the year, some changes are made to the cost index for road goods transport. Among other things, January 2009 is introduced as the new reference period for the index in such a way that January 2009 now equals 100. The index figures for previous months have also been recalculated in order to ensure that the cost development between two index periods is unchanged. You will find further information on these changes in the fact section at the end of this article. |
Rise in diesel prices
The fuel index increased by 3.3 per cent in the last month as a result of increased oil prices. Over the last twelve months, however, this sub-index has decreased by 2.4 per cent.
The fuel index is based on actual pump prices obtained from a selection of retailers located around Norway. Surveys show that the development in pump prices is very similar to the development in the contract prices for fuel supplied by the major distributors, although some discrepancies may occur in certain months.
Higher insurance costs
The insurance cost index increased by 3.3 per cent in the last month. Over the last twelve months insurance costs have increased by 6.1 per cent.
Increase in ferry costs and road tolls
The sub-index for ferry and road toll costs increased by 0.9 per cent in the last month. Over the last twelve months the sub-index for ferry and road toll costs has increased by 59.6 per cent.
The total cost index for road goods transport excluding ferry costs and road tolls has risen by 3.0 per cent over the last twelve months, which is slightly less then the total index including ferry costs and road tolls.
Lower capital costs
The index for capital costs decreased by 0.9 per cent from December 2008 to January 2009, mainly due to a decrease in real interest rates, which are used for calculating interest costs in this sub-index. , This index, which is made up of depreciation and amortization, interest costs and annual fees, has increased by 4.3 per cent over the last twelve months.
Slight increase in administration costs
The sub-index for administration costs increased by 0.4 per cent in the last month. Over the last twelve months this sub-index has increased by 1.8 per cent.
Changes in the index from January 2009Since January 2009, the statistics have been produced using weights based on accounting figures for 2007 from a sample of enterprises in the road goods transport industry. January 2009 was introduced as the new reference period for the indices at the same time, whereby January 2009 now equals 100. The index figures for previous months have also been recalculated and chained in order to ensure that the development in costs between two index periods is unchanged. |
How to use the new index figuresIn order to calculate the development in costs from a month prior to the changes in the index figures to a month after the changes, it is necessary to use the recalculated index figure for the first of the months. Even though the index figures are new, the calculation of the development in costs between the two months has not changed. Example - development in costs from January 2008 to January 2009: Using the “old” index figures: (151.1 - 145.0) / 145.0 = 0.042 Using the recalculated index figures: (100 - 95.9) / 95.9 = 0.042 In both calculations the cost index for road goods transport has increased by 4.2 per cent in this period. The formula for calculating the change in costs between two months is: (last month - first month) / first month. The change in percentage is obtained by multiplying the result with 100. |
New total indices for road goods transportSince January 2009, a total cost index for road goods transport has also been calculated. The total cost index is a weighted average of the cost indices for the ten vehicle groups in the statistics. At the industry’s request, cost indices excluding ferry costs and road tolls have also been calculated since January 2009. Further information on these new total indices is available in the section “About the statistics”. In addition to the cost index for road goods transport, Statistics Norway compiles a price index that measures the development in the actual billed prices of transport services. Information on this price index can be found here: http://www.ssb.no/gvpi_en/ |
Tables:
Contact
-
Gudveig Ihlang
E-mail: gudveig.ihlang.braten@ssb.no
tel.: (+47) 40 81 13 85
-
Geir Martin Pilskog
E-mail: geir.martin.pilskog@ssb.no
tel.: (+47) 40 81 13 83


