Content
Published:
This is an archived release.
Price growth for business activities
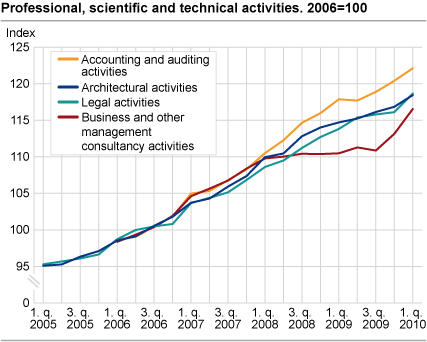
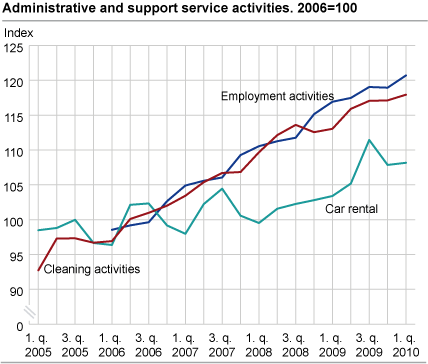
All of Statistics Norway’s price indices for business activities showed an increase from the 1st quarter of 2009 to the 1st quarter of 2010. The highest growth was for business and management consultancy activities and car rental.
From the 1st quarter of 2009 to the 1st quarter of 2010 the prices for business and management consultancy activities increased by 4.6 per cent. Compared with the previous quarter, prices for business consulting rose by 2.2 per cent. After a low growth in 2009, the prices now seem to be showing a greater increase.
Car rental prices up 4.6 per cent
The prices for car rental increased by 4.6 per cent from the 1st quarter of 2009 to the 1st quarter of 2010. Compared with the same period last year, private customers paid almost 10 per cent more for car rental services in the 1st quarter of 2010.
Lower growth for employment activities
Prices for employment activities increased by 3.3 per cent between the 1st quarter of 2009 and the 1st quarter of 2010. The last two quarters showed a lower growth than earlier periods. Compared with the last quarter, the prices rose by 1.5 per cent in the 1st quarter of 2010.
Moderate increase in prices for legal, accounting and architectural activities
Compared to the 1st quarter of 2009, the first quarter of 2010 showed a growth in prices of 3.6 per cent for accounting and auditing activities. Auditing activity prices increased the most, by 4.3 per cent.
From the 1st quarter of 2009 to the 1st quarter of 2010, the prices for legal activities rose 4.3 per cent. The increase was most notable for business clients, who experienced a growth of 5.3 per cent. This group of clients accounts for more than 60 per cent of turnover in the industry.
In the 1st quarter of 2010 the prices for architectural activities were 3.2 per cent higher than in the same period in 2009. Compared to the 4th quarter of 2009, the prices rose by 1.4 per cent in the 1st quarter of 2010.
Continuous growth in the prices for cleaning activities
The prices for industrial cleaning activities increased by 4.3 per cent in the period between the 1st quarter of 2009 and the 1st quarter of 2010. Compared to the 4th quarter of 2009, the prices rose by 0.7 per cent.
| Industry |
Price index
1. quarter 2010 |
Change in per cent | |||||||||||||||||||||||||||||||||||||||||||||||||||||||||||||||||||||||||||||
|---|---|---|---|---|---|---|---|---|---|---|---|---|---|---|---|---|---|---|---|---|---|---|---|---|---|---|---|---|---|---|---|---|---|---|---|---|---|---|---|---|---|---|---|---|---|---|---|---|---|---|---|---|---|---|---|---|---|---|---|---|---|---|---|---|---|---|---|---|---|---|---|---|---|---|---|---|---|---|---|
|
4. quarter 2009-
1. quarter 2010 |
1. quarter 2009-
1. quarter 2010 |
||||||||||||||||||||||||||||||||||||||||||||||||||||||||||||||||||||||||||||||
| Legal activities | 118.7 | 2.2 | 4.3 | ||||||||||||||||||||||||||||||||||||||||||||||||||||||||||||||||||||||||||||
| Accounting and auditing activities | 122.1 | 1.4 | 3.6 | ||||||||||||||||||||||||||||||||||||||||||||||||||||||||||||||||||||||||||||
| Business and other management consultancy activities | 115.6 | 2.2 | 4.6 | ||||||||||||||||||||||||||||||||||||||||||||||||||||||||||||||||||||||||||||
| Architectural activities | 118.4 | 1.4 | 3.2 | ||||||||||||||||||||||||||||||||||||||||||||||||||||||||||||||||||||||||||||
| Car rental | 108.2 | 0.3 | 4.6 | ||||||||||||||||||||||||||||||||||||||||||||||||||||||||||||||||||||||||||||
| Employment activities | 120.7 | 1.5 | 3.3 | ||||||||||||||||||||||||||||||||||||||||||||||||||||||||||||||||||||||||||||
| Cleaning activities | 117.9 | 0.7 | 4.3 | ||||||||||||||||||||||||||||||||||||||||||||||||||||||||||||||||||||||||||||
Additional information
From the 1st quarter of 2012, the base period is set at 2010=100. This will only result in a change of the index level and will not affect any other data.
Contact
-
Håvard Georg Jensen
E-mail: havard.jensen@ssb.no
tel.: (+47) 40 90 26 86
-
Trym Langballe
E-mail: trym.langballe@ssb.no
tel.: (+47) 97 79 57 13
-
Mats Halvorsen
E-mail: mats.halvorsen@ssb.no
tel.: (+47) 40 90 24 33
-
Morten Madshus
E-mail: morten.madshus@ssb.no
tel.: (+47) 40 90 26 94


