Content
Published:
This is an archived release.
Lower energy prices
The Producer price index decreased by 0.5 per cent from April to May 2010. Lower prices of electricity and oil were the two most important reasons behind the fall in the overall index.
Electricity prices fell by 11.3 per cent from April to May 2010. This was the most important reason behind a decrease of 0.5 per cent in the Producer price index for this period. Another important explanation behind the fall in the overall index was slightly lower prices within extraction of oil and natural gas.
Prices within basic metals had a development that moved the index in the opposite direction. Prices of non-ferrous metals were 2.1 per cent higher in May than in April. Prices of other basic metals also went up during this period. Basic metals experienced an overall price rise of 2.8 per cent despite the decrease in spot prices (London Metal Exchange) of several non-ferrous metals in the same period.
Food prices rose by 0.9 per cent from April to May 2010. Important reasons for this price increase were higher export prices of fish and rising prices of meat products on the domestic market.
Lower twelve-month growth
The Producer price index rose by 18.4 per cent from April to May 2010. Most industries experienced price increases during this period. Exceptions were machinery and equipment, chemical and pharmaceutical products, mining and quarrying as well as paper and paper products, where prices decreased 0.8, 5.0, 11.3 and 5.1 per cent respectively.
The twelve-month growth sank by 8.3 percentage points from April 2010 to May 2010. An important reason for the fall in the twelve-month growth was a sharp price rise within extraction of oil and natural gas as well as refined petroleum products from April to May last year, while prices fell in the same period this year.
| May 2010 | Changes, per cent | ||||||||||||||||||||||||||||||||||||||||||||||||||||||||||||||||||||||||||||||
|---|---|---|---|---|---|---|---|---|---|---|---|---|---|---|---|---|---|---|---|---|---|---|---|---|---|---|---|---|---|---|---|---|---|---|---|---|---|---|---|---|---|---|---|---|---|---|---|---|---|---|---|---|---|---|---|---|---|---|---|---|---|---|---|---|---|---|---|---|---|---|---|---|---|---|---|---|---|---|---|
| April 2010-May 2010 | May 2009-May 2010 | ||||||||||||||||||||||||||||||||||||||||||||||||||||||||||||||||||||||||||||||
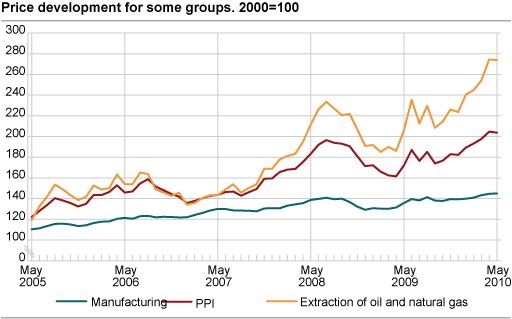
| Total index | 203.7 | -0.5 | 18.4 | ||||||||||||||||||||||||||||||||||||||||||||||||||||||||||||||||||||||||||||
| Extraction of oil and natural gas | 273.8 | -0.3 | 33.1 | ||||||||||||||||||||||||||||||||||||||||||||||||||||||||||||||||||||||||||||
| Manufacturing, mining and quarrying | 144.9 | 0.3 | 6.5 | ||||||||||||||||||||||||||||||||||||||||||||||||||||||||||||||||||||||||||||
| Electricity, gas and steam supply | 302.1 | -11.3 | 24.8 | ||||||||||||||||||||||||||||||||||||||||||||||||||||||||||||||||||||||||||||
| Main industrial groupings | |||||||||||||||||||||||||||||||||||||||||||||||||||||||||||||||||||||||||||||||
| Intermediate goods | 137.5 | 1.1 | 7.2 | ||||||||||||||||||||||||||||||||||||||||||||||||||||||||||||||||||||||||||||
| Investment goods | 125.1 | -0.3 | -0.7 | ||||||||||||||||||||||||||||||||||||||||||||||||||||||||||||||||||||||||||||
| Consumer goods | 125.9 | 0.9 | 2.9 | ||||||||||||||||||||||||||||||||||||||||||||||||||||||||||||||||||||||||||||
| Energy goods | 266.4 | -1.3 | 29.8 | ||||||||||||||||||||||||||||||||||||||||||||||||||||||||||||||||||||||||||||
For information on the commodity price index for the industrial sectors, see http://www.ssb.no/vppi_en
Additional information
Contact
-
Producer price index
E-mail: produsentpris@ssb.no
tel.: (+47) 21 09 40 00
-
Elisabeth Mælum
E-mail: elisabeth.maelum@ssb.no
tel.: (+47) 97 01 28 49
-
Morten Madshus
E-mail: morten.madshus@ssb.no
tel.: (+47) 40 90 26 94
-
Monika Græsli Engebretsen
E-mail: monika.graesli.engebretsen@ssb.no
tel.: (+47) 40 90 23 71
-
Håvard Georg Jensen
E-mail: havard.jensen@ssb.no
tel.: (+47) 40 90 26 86