Content
Published:
This is an archived release.
Oil and gas pulled PIF upwards
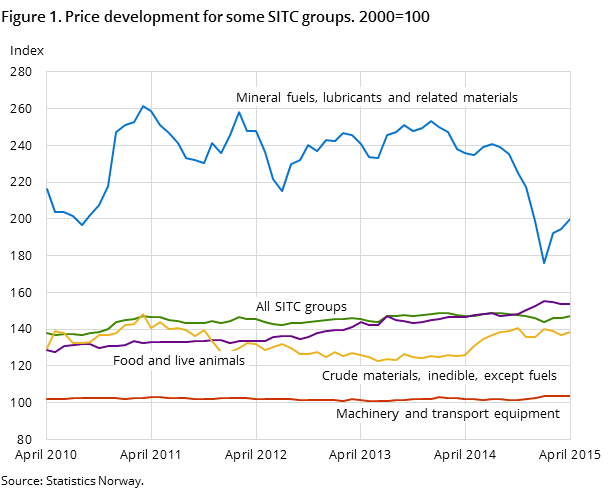
The price index of first-hand domestic sales (PIF) increased by 0.9 per cent from March to April. Prices for most groups of goods rose, with petroleum products and natural gas making important contributions.
| Per cent | Per cent | Index | Weights1 | |
|---|---|---|---|---|
| April 2015 / March 2015 | April 2015 / April 2014 | April 2015 | ||
| 1The weights are updated annually, and are valid for the entire year. | ||||
| Product groups | ||||
| Total index | 0.9 | 0.0 | 147.2 | 1 000.0 |
| Food | 0.2 | 4.9 | 153.9 | 192.6 |
| Beverages and tobacco | 0.4 | 5.9 | 162.5 | 14.3 |
| Crude materials, inedible, except fuels | 1.3 | 10.2 | 138.5 | 47.7 |
| Mineral fuels, lubricants and related materials | 2.6 | -15.3 | 199.6 | 218.4 |
| Chemicals and related products, n.e.s. | 1.6 | 3.9 | 154.2 | 65.2 |
| Manufactured goods classified by material | 0.4 | 4.5 | 137.4 | 130.9 |
| Machinery and transport equipment | 0.2 | 1.4 | 103.6 | 229.7 |
| Miscellaneous manufactured articles | 0.8 | 3.8 | 119.3 | 94.6 |

Prices rose within every product group with the exception of animal and vegetable oils, fats and waxes. Prices within mineral fuels, lubricants and related materials increased due to higher prices within petroleum and petroleum products and natural gas. Within chemicals, prices rose mainly due to higher prices on organic chemicals and plastics.
Weakening in Norwegian currency
Higher prices on imported clothing contributed to the rise in the index of miscellaneous manufactured articles from March to April. According to Virke, the Enterprise Federation of Norway, two- thirds of all imported clothing comes from Asia and is paid for in US dollars. From April 2013 to April 2015, prices on clothing rose by 12.5 per cent. During the same period, the US currency strengthened by 36 per cent compared to the Norwegian krone.
No change to PIF over the last twelve months
From April 2014 to April 2015, the PIF was unchanged. The overall price decrease within mineral fuels, lubricants and related materials was dampened by higher prices in the remaining product groups. One of the product groups that contributed to pulling the index up was food and live animals, where prices rose by 4.9 per cent.
Additional information
Contact
-
Producer price index
E-mail: produsentpris@ssb.no
tel.: (+47) 21 09 40 00
-
Elisabeth Mælum
E-mail: elisabeth.maelum@ssb.no
tel.: (+47) 97 01 28 49
-
Monika Græsli Engebretsen
E-mail: monika.graesli.engebretsen@ssb.no
tel.: (+47) 40 90 23 71
-
Morten Madshus
E-mail: morten.madshus@ssb.no
tel.: (+47) 40 90 26 94
