Content
Published:
This is an archived release.
Higher electricity prices in October
The price index of first-hand domestic sales (PIF) increased by 0.6 per cent from September to October. The price rise in electricity played the largest role in bringing the PIF up in October. From October 2011 to October 2012, the PIF increased by 0.5 per cent.
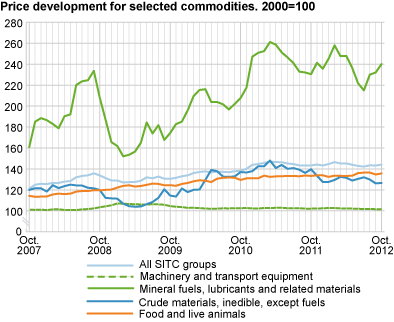
An increase in the PIF of 0.6 per cent from September to October 2012 can be explained by higher prices in mineral fuels, lubricants and related materials as well as food products. Prices in mineral fuels, lubricants and related materials rose by 3.4 per cent as a result of higher electricity prices. Electricity prices increased by more than 22 per cent from September to October due to a higher system price at Nord Pool, as well as an increase in prices of electricity sold to Norwegian households. Prices in petroleum and petroleum products, on the other hand, dropped by 2.1 per cent and helped curb inflation in the group.
Food was another group with a price increase in October. Prices in this group increased by 0.7 per cent in October, with most of the food groups experiencing price increases. Fish and fish products rose as much as 3.6 per cent.
The price increase in the PIF was moderated by chemicals and manufactured goods classified by material. Prices in these groups decreased by 0.4 and 0.5 per cent respectively.
The PIF up 0.5 per cent from October 2011 to October 2012
Price growth in mineral fuels, lubricants and related materials, as well as food products was the main cause for the increase in the PIF from October 2011 to October 2012. Mineral fuels, lubricants and related materials rose by 4.2 per cent as a result of 5.8 per cent higher prices in petroleum and petroleum products. Despite a large increase in electricity prices from September to October, electricity was 0.5 per cent cheaper in October 2011 than a year ago. This is despite the fact that electricity prices in October 2011 were the lowest for the year.
Food prices rose by 1.8 per cent from October 2011 to October 2012. Prices in most of the food groups increased due to higher prices in both Norwegian-produced and imported goods. Food groups with the largest price rise were meat and meat preparations, vegetables and fruits, as well as feeding stuff for animals. Prices in these groups increased by 4.5, 5.1 and 10.0 per cent respectively. Fish and fish products, as well as coffee, tea, cocoa and spices were food groups that experienced price falls in this period.
Decline in crude materials affected manufactured goods
Crude materials and manufactured goods classified by material were two commodity groups that curbed the rise in the PIF in this twelve-month period. Prices in these groups fell by 9.4 and 1.1 per cent respectively. Within crude materials, wood, lumber and cork, pulp and waste paper, as well as metalliferous ores and metal scrap fell in price. A drop in crude materials meant fluctuations in the prices of manufactured goods. Articles of iron, steel and metals contributed most to the decline in the manufactured goods. Articles of paper, paperboard, cork and wood have also experienced price declines.
| October 2012 | Changes, per cent | ||||||||||||||||||||||||||||||||||||||||||||||||||||||||||||||||||||||||||||||
|---|---|---|---|---|---|---|---|---|---|---|---|---|---|---|---|---|---|---|---|---|---|---|---|---|---|---|---|---|---|---|---|---|---|---|---|---|---|---|---|---|---|---|---|---|---|---|---|---|---|---|---|---|---|---|---|---|---|---|---|---|---|---|---|---|---|---|---|---|---|---|---|---|---|---|---|---|---|---|---|
|
September 2012-
October 2012 |
October 2011-
October 2012 |
||||||||||||||||||||||||||||||||||||||||||||||||||||||||||||||||||||||||||||||
| Total index | 144.1 | 0.6 | 0.5 | ||||||||||||||||||||||||||||||||||||||||||||||||||||||||||||||||||||||||||||
| Food and live animals | 135.7 | 0.7 | 1.8 | ||||||||||||||||||||||||||||||||||||||||||||||||||||||||||||||||||||||||||||
| Beverages and tobacco | 144.4 | - | 4.1 | ||||||||||||||||||||||||||||||||||||||||||||||||||||||||||||||||||||||||||||
| Crude materials, inedible, except fuels | 126.6 | 0.3 | -9.4 | ||||||||||||||||||||||||||||||||||||||||||||||||||||||||||||||||||||||||||||
| Mineral fuels, lubricants and related materials | 240.1 | 3.4 | 4.2 | ||||||||||||||||||||||||||||||||||||||||||||||||||||||||||||||||||||||||||||
| Chemicals and related products, n.e.s | 139.2 | -0.4 | 1.0 | ||||||||||||||||||||||||||||||||||||||||||||||||||||||||||||||||||||||||||||
| Manufactured goods classified by material | 130.3 | -0.5 | -1.1 | ||||||||||||||||||||||||||||||||||||||||||||||||||||||||||||||||||||||||||||
| Machinery and transport equipment | 101.5 | -0.1 | -0.6 | ||||||||||||||||||||||||||||||||||||||||||||||||||||||||||||||||||||||||||||
| Miscellaneous manufactured articles | 111.5 | - | 1.0 | ||||||||||||||||||||||||||||||||||||||||||||||||||||||||||||||||||||||||||||
Additional information
Contact
-
Producer price index
E-mail: produsentpris@ssb.no
tel.: (+47) 21 09 40 00
-
Elisabeth Mælum
E-mail: elisabeth.maelum@ssb.no
tel.: (+47) 97 01 28 49
-
Monika Græsli Engebretsen
E-mail: monika.graesli.engebretsen@ssb.no
tel.: (+47) 40 90 23 71
-
Morten Madshus
E-mail: morten.madshus@ssb.no
tel.: (+47) 40 90 26 94

