Content
Published:
This is an archived release.
Higher prices of energy and food
The Price index of first-hand domestic sales (PIF) rose by 1.3 per cent from January to February 2012. Higher prices of energy and food were important reasons behind the increase in the PIF.
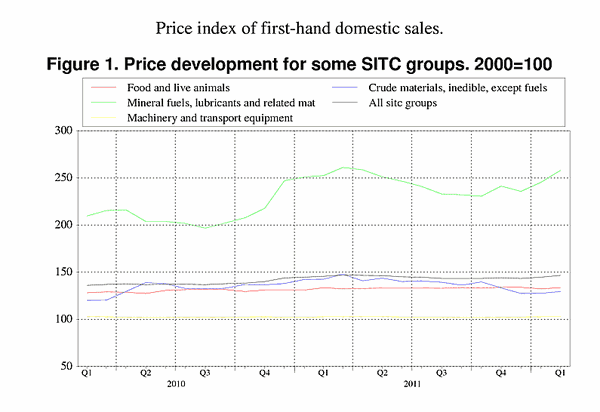
The PIF rose by 1.3 per cent from January to February 2012. The increase was to a large part due to higher energy prices and higher prices of food products. Prices within mineral fuels, lubricants and related materials rose by 5.1 per cent, first and foremost because electricity prices shot up more than 17 per cent. Prices of food products also increased in this period, up 0.9 per cent from January to February. For several groups of food such as vegetables and fruit, dairy products, meat and meat preparations as well as cereals and cereal preparations, prices increased both on the domestic market and for imported goods.
Twelve-month change: PIF rose by 0.5 per cent
The PIF rose by 0.5 per cent from February 2011 to February 2012. This was mainly due to an increase of 2.2 per cent in prices of mineral fuels, lubricants and related materials. However, within this commodity group, prices of petroleum and petroleum products increased 13 per cent, and this was the main reason behind the increase in the PIF during the period. Electricity prices on the other hand showed a downturn of 22.5 per cent during the same period.
| February 2012 | Changes, per cent | ||||||||||||||||||||||||||||||||||||||||||||||||||||||||||||||||||||||||||||||
|---|---|---|---|---|---|---|---|---|---|---|---|---|---|---|---|---|---|---|---|---|---|---|---|---|---|---|---|---|---|---|---|---|---|---|---|---|---|---|---|---|---|---|---|---|---|---|---|---|---|---|---|---|---|---|---|---|---|---|---|---|---|---|---|---|---|---|---|---|---|---|---|---|---|---|---|---|---|---|---|
| January 2012-February 2012 | February 2011-February 2012 | ||||||||||||||||||||||||||||||||||||||||||||||||||||||||||||||||||||||||||||||
| Total index | 146.5 | 1.3 | 0.5 | ||||||||||||||||||||||||||||||||||||||||||||||||||||||||||||||||||||||||||||
| Food and live animals | 133.6 | 0.9 | - | ||||||||||||||||||||||||||||||||||||||||||||||||||||||||||||||||||||||||||||
| Beverages and tobacco | 138.9 | 0.3 | 2.6 | ||||||||||||||||||||||||||||||||||||||||||||||||||||||||||||||||||||||||||||
| Crude materials, inedible, except fuels | 129.5 | 1.5 | -9.2 | ||||||||||||||||||||||||||||||||||||||||||||||||||||||||||||||||||||||||||||
| Mineral fuels, lubricants and related materials | 258.0 | 5.1 | 2.2 | ||||||||||||||||||||||||||||||||||||||||||||||||||||||||||||||||||||||||||||
| Chemicals and related products, n.e.s | 142.2 | 1.6 | 5.4 | ||||||||||||||||||||||||||||||||||||||||||||||||||||||||||||||||||||||||||||
| Manufactured goods classified by material | 132.0 | -0.2 | 0.7 | ||||||||||||||||||||||||||||||||||||||||||||||||||||||||||||||||||||||||||||
| Machinery and transport equipment | 102.7 | - | - | ||||||||||||||||||||||||||||||||||||||||||||||||||||||||||||||||||||||||||||
| Miscellaneous manufactured articles | 111.2 | - | 1.6 | ||||||||||||||||||||||||||||||||||||||||||||||||||||||||||||||||||||||||||||
Additional information
Contact
-
Producer price index
E-mail: produsentpris@ssb.no
tel.: (+47) 21 09 40 00
-
Elisabeth Mælum
E-mail: elisabeth.maelum@ssb.no
tel.: (+47) 97 01 28 49
-
Monika Græsli Engebretsen
E-mail: monika.graesli.engebretsen@ssb.no
tel.: (+47) 40 90 23 71
-
Morten Madshus
E-mail: morten.madshus@ssb.no
tel.: (+47) 40 90 26 94

