Content
Published:
This is an archived release.
Continued decrease in PIF
The price index of first-hand domestic sales (PIF) fell by 0.8 per cent from July to August. Prices in mineral fuels, lubricants and related materials, as well as chemicals, crude materials and food played a large role in bringing the total index down.
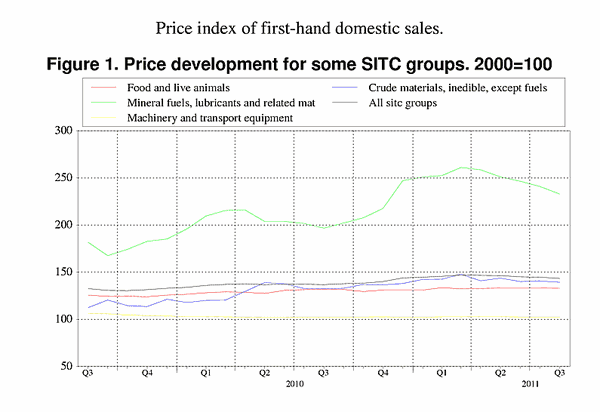
The price index of first-hand domestic sales fell for the fifth consecutive month in August, as prices in several of the major commodity groups declined. The group mineral fuels, lubricants and related materials fell 3.4 per cent and had the greatest impact on PIF. It was the drop in crude oil prices that pulled the group down. Electricity prices were slightly lower in August than in the previous month.
Prices within the group chemicals and related products have fallen since May, with a further price decrease in August of 1.5 per cent. The price decline in the group was connected to lower prices in the domestic market due to a price fall in inorganic and organic chemicals, as well as plastics in primary forms. Crude materials, inedible, except fuels was another group that fell from July to August, with 1.1 per cent lower prices. Most sub-groups contributed to the price decline.
Fluctuation in food prices
Food prices fell by 0.2 per cent in August. Despite the relatively small price change in the group there were several sub-groups that experienced greater price fluctuations. The three sub-groups, vegetables and fruit, fish and fish products as well as feeding stuff for animals, were the most important to the decline in prices in food. The price fall in vegetables and fruit of 4.1 per cent was due to lower prices in the domestic market. Prices in vegetables and fruit rose sharply from June to July as a result of the season for a number of Norwegian-produced vegetables, and then fell by 8.9 per cent in August. Such seasonal variations in vegetable prices are not uncommon in the summer months. With regard to prices in fish and fish products as well as feeding stuff for animals, the price fall in these groups was due to lower import prices. Fish prices have been falling for some time, and we need to go back to May 2010 to find lower prices of fish. The sub-groups that experienced price increases in August were meat and meat preparations, together with cereals and cereal preparations, which increased by 0.5 and 1.6 per cent respectively.
Twelve-month change: 4.7 per cent increase
PIF increased by 4.7 per cent from August 2010 to August 2011. The rise in PIF in this twelve-month period is primarily due to high prices in mineral fuels, lubricants and related materials, which increased by 18.3 per cent. An important reason for this price rise was higher prices of petroleum and petroleum products, while electricity prices helped to curb the price rise in this group. Manufactured goods classified by material, chemical products and crude materials also made a significant contribution to PIF, with price increases of 2.6, 4.5 and 5.2 per cent respectively.
| August 2011 | Changes, per cent | ||||||||||||||||||||||||||||||||||||||||||||||||||||||||||||||||||||||||||||||
|---|---|---|---|---|---|---|---|---|---|---|---|---|---|---|---|---|---|---|---|---|---|---|---|---|---|---|---|---|---|---|---|---|---|---|---|---|---|---|---|---|---|---|---|---|---|---|---|---|---|---|---|---|---|---|---|---|---|---|---|---|---|---|---|---|---|---|---|---|---|---|---|---|---|---|---|---|---|---|---|
| July 2010-August 2011 | August 2010-August 2011 | ||||||||||||||||||||||||||||||||||||||||||||||||||||||||||||||||||||||||||||||
| Total index | 143.4 | -0.8 | 4.7 | ||||||||||||||||||||||||||||||||||||||||||||||||||||||||||||||||||||||||||||
| Food and live animals | 133.0 | -0.2 | 1.0 | ||||||||||||||||||||||||||||||||||||||||||||||||||||||||||||||||||||||||||||
| Beverages and tobacco | 137.0 | 0.7 | -0.9 | ||||||||||||||||||||||||||||||||||||||||||||||||||||||||||||||||||||||||||||
| Crude materials, inedible, except fuels | 139.3 | -1.1 | 5.2 | ||||||||||||||||||||||||||||||||||||||||||||||||||||||||||||||||||||||||||||
| Mineral fuels, lubricants and related materials | 232.9 | -3.4 | 18.3 | ||||||||||||||||||||||||||||||||||||||||||||||||||||||||||||||||||||||||||||
| Chemicals and related products, n.e.s | 134.5 | -1.5 | 4.5 | ||||||||||||||||||||||||||||||||||||||||||||||||||||||||||||||||||||||||||||
| Manufactured goods classified by material | 132.7 | -0.1 | 2.6 | ||||||||||||||||||||||||||||||||||||||||||||||||||||||||||||||||||||||||||||
| Machinery and transport equipment | 102.5 | 0.1 | 0.2 | ||||||||||||||||||||||||||||||||||||||||||||||||||||||||||||||||||||||||||||
| Miscellaneous manufactured articles | 109.9 | - | 1.0 | ||||||||||||||||||||||||||||||||||||||||||||||||||||||||||||||||||||||||||||
Additional information
Contact
-
Producer price index
E-mail: produsentpris@ssb.no
tel.: (+47) 21 09 40 00
-
Elisabeth Mælum
E-mail: elisabeth.maelum@ssb.no
tel.: (+47) 97 01 28 49
-
Monika Græsli Engebretsen
E-mail: monika.graesli.engebretsen@ssb.no
tel.: (+47) 40 90 23 71
-
Morten Madshus
E-mail: morten.madshus@ssb.no
tel.: (+47) 40 90 26 94