Content
Published:
This is an archived release.
Higher prices of crude materials
The price index of first-hand domestic sales (PIF) rose by 0.6 per cent from December 2010 to January 2011. An important contribution to this increase was a 3.3 per cent growth in prices of crude materials.
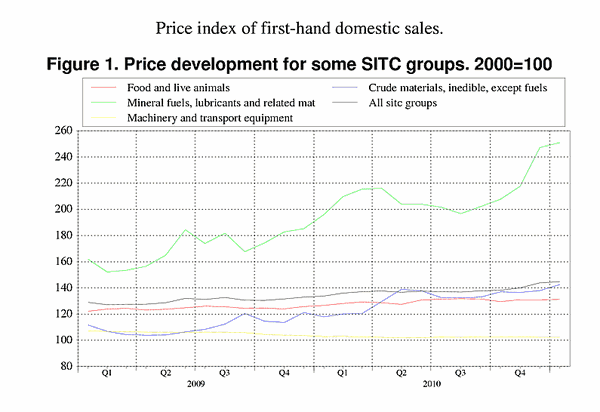
Except for a slight decrease from October to November, crude materials (inedible, except fuels) have experienced rising prices since august 2010. The largest contributions to the price rise from December 2010 to January 2011 are those of metalliferous ores and metal scrap, together with crude fertilizers and crude minerales and paper and paper waste. For these three groups prices increased by 8, 2.8, and 3.1 per cent, respectively. Wood, lumber and cork, on the other hand, saw a price drop of 1.9 per cent.
Although electricity prices fell 4.6 per cent from December to January, increased prices of petroleum and petroleum products, as well as higher gas prises, caused a rise in the index of mineral fuels, lubricants and related materials from December to January.
Food prices rose 0.1 per cent, mainly because of a climb of 2.6 per cent in prices of feeding stuff for animals from December to January. Prices of several other food commodity groups decreased slightly during the same period.
Twelve month change: 8.1 per cent increase
From January 2010 to January 2011 PIF rose 8.1 per cent. Much of the price increase since January last year is due to price increases in petroleum and petroleum products, electricity and crude materials.
New weightsEntering a new year, the weights used for calculating the price index have been updated. The weights express the influence of different goods on the total price index, and are based on the shares of different goods in the total value of turnover in the Norwegian economy in the previous year. Compared with 2010, crude materials, inedible, except fuels as well as mineral fuels, lubricants and related materials have a larger impact in the index in 2011, while food and live animals, machinery and transport equipment as well as miscellaneous manufactured goods have smaller weights. |
| January 2011 | Changes, per cent | ||||||||||||||||||||||||||||||||||||||||||||||||||||||||||||||||||||||||||||||
|---|---|---|---|---|---|---|---|---|---|---|---|---|---|---|---|---|---|---|---|---|---|---|---|---|---|---|---|---|---|---|---|---|---|---|---|---|---|---|---|---|---|---|---|---|---|---|---|---|---|---|---|---|---|---|---|---|---|---|---|---|---|---|---|---|---|---|---|---|---|---|---|---|---|---|---|---|---|---|---|
| December 2010-January 2011 | January 2010-January 2011 | ||||||||||||||||||||||||||||||||||||||||||||||||||||||||||||||||||||||||||||||
| Total index | 144.7 | 0.6 | 8.1 | ||||||||||||||||||||||||||||||||||||||||||||||||||||||||||||||||||||||||||||
| Food and live animals | 131.1 | 0.1 | 3.6 | ||||||||||||||||||||||||||||||||||||||||||||||||||||||||||||||||||||||||||||
| Beverages and tobacco | 134.5 | -0.7 | -2.0 | ||||||||||||||||||||||||||||||||||||||||||||||||||||||||||||||||||||||||||||
| Crude materials, inedible, except fuels | 142.5 | 3.3 | 20.9 | ||||||||||||||||||||||||||||||||||||||||||||||||||||||||||||||||||||||||||||
| Mineral fuels, lubricants and related materials | 250.9 | 1.5 | 27.9 | ||||||||||||||||||||||||||||||||||||||||||||||||||||||||||||||||||||||||||||
| Chemicals and related products, n.e.s | 132.5 | -0.2 | 5.6 | ||||||||||||||||||||||||||||||||||||||||||||||||||||||||||||||||||||||||||||
| Manufactured goods classified by material | 131.2 | 0.2 | 5.3 | ||||||||||||||||||||||||||||||||||||||||||||||||||||||||||||||||||||||||||||
| Machinery and transport equipment | 102.2 | -0.1 | -0.6 | ||||||||||||||||||||||||||||||||||||||||||||||||||||||||||||||||||||||||||||
| Miscellaneous manufactured articles | 109.2 | -0.2 | 0.6 | ||||||||||||||||||||||||||||||||||||||||||||||||||||||||||||||||||||||||||||
Additional information
Contact
-
Producer price index
E-mail: produsentpris@ssb.no
tel.: (+47) 21 09 40 00
-
Elisabeth Mælum
E-mail: elisabeth.maelum@ssb.no
tel.: (+47) 97 01 28 49
-
Monika Græsli Engebretsen
E-mail: monika.graesli.engebretsen@ssb.no
tel.: (+47) 40 90 23 71
-
Morten Madshus
E-mail: morten.madshus@ssb.no
tel.: (+47) 40 90 26 94