Content
Published:
This is an archived release.
Decline in food prices
Price index of first-hand domestic sales (PIF) decreased by 0.2 per cent from August to September 2012. Lower prices of food products was an important reason behind the decrease in PIF.
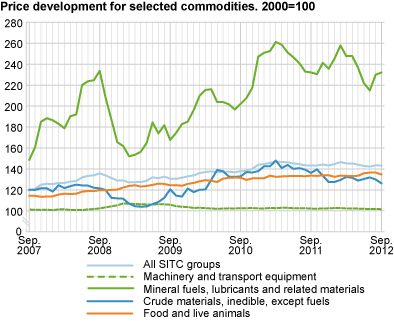
PIF decreased by 0.2 per cent from August to September 2012. The main reason behind the decrease was a price decline of 1.3 per cent in food products and 2.8 per cent lower prices of crude materials (inedible, except fuels). The most important contributions to dampening the decrease in PIF came from the two commodity groups mineral fuels, lubricants and related materials as well as chemicals and related products, where prices rose by 0.9 per cent and 1.3 per cent respectively.
Lower prices of food products
Prices of food products sank 1.3 per cent from August to September 2012. Prices of imported food as well as prices of domestically produced food products declined. All subgroups of food products except domestic market prices of dairy products and birds eggs experienced price decreases.
Twelve month change: 0.1 per cent lower prices
There was a modest decrease in PIF from September 2011 to September 2012. A price drop of more than 19 per cent in electricity prices as well as 7.3 per cent lower prices of crude materials (inedible, except fuels) were the most important explanations behind the decrease. Several subgroups of crude materials, such as metalliferous ores and metal scrap, wood, lumber and cork as well as pulp and waste paper experienced price decreases during this twelve-month period.
Price of petroleum and petroleum products rose 7 per cent in the same period. This, in addition to price increases within the four product groups chemicals and related products, animal and vegetable oils, fats and waxes as well as food products and miscellaneous manufactured articles contributed to dampening the decrease in the twelve month change in PIF from September 2011 to September 2012. Prices of food products were 0.7 per cent higher in September 2012 than September 2011, and most product groups experienced price increases during the period. One exception was fish, crustaceans, molluscs and preparations thereof, where prices fell more than 13 per cent on the domestic market.
| September 2012 | Changes, per cent | ||||||||||||||||||||||||||||||||||||||||||||||||||||||||||||||||||||||||||||||
|---|---|---|---|---|---|---|---|---|---|---|---|---|---|---|---|---|---|---|---|---|---|---|---|---|---|---|---|---|---|---|---|---|---|---|---|---|---|---|---|---|---|---|---|---|---|---|---|---|---|---|---|---|---|---|---|---|---|---|---|---|---|---|---|---|---|---|---|---|---|---|---|---|---|---|---|---|---|---|---|
|
August 2012-
September 2012 |
September 2011-
September 2012 |
||||||||||||||||||||||||||||||||||||||||||||||||||||||||||||||||||||||||||||||
| Total index | 143.2 | -0.2 | -0.1 | ||||||||||||||||||||||||||||||||||||||||||||||||||||||||||||||||||||||||||||
| Food and live animals | 134.7 | -1.3 | 0.7 | ||||||||||||||||||||||||||||||||||||||||||||||||||||||||||||||||||||||||||||
| Beverages and tobacco | 144.4 | 0.3 | 4.1 | ||||||||||||||||||||||||||||||||||||||||||||||||||||||||||||||||||||||||||||
| Crude materials, inedible, except fuels | 126.2 | -2.8 | -7.3 | ||||||||||||||||||||||||||||||||||||||||||||||||||||||||||||||||||||||||||||
| Mineral fuels, lubricants and related materials | 232.1 | 0.9 | - | ||||||||||||||||||||||||||||||||||||||||||||||||||||||||||||||||||||||||||||
| Chemicals and related products, n.e.s | 139.8 | 1.3 | 3.0 | ||||||||||||||||||||||||||||||||||||||||||||||||||||||||||||||||||||||||||||
| Manufactured goods classified by material | 130.9 | 0.1 | -0.9 | ||||||||||||||||||||||||||||||||||||||||||||||||||||||||||||||||||||||||||||
| Machinery and transport equipment | 101.6 | -0.1 | -0.5 | ||||||||||||||||||||||||||||||||||||||||||||||||||||||||||||||||||||||||||||
| Miscellaneous manufactured articles | 111.5 | -0.1 | 1.2 | ||||||||||||||||||||||||||||||||||||||||||||||||||||||||||||||||||||||||||||
Additional information
Contact
-
Producer price index
E-mail: produsentpris@ssb.no
tel.: (+47) 21 09 40 00
-
Elisabeth Mælum
E-mail: elisabeth.maelum@ssb.no
tel.: (+47) 97 01 28 49
-
Monika Græsli Engebretsen
E-mail: monika.graesli.engebretsen@ssb.no
tel.: (+47) 40 90 23 71
-
Morten Madshus
E-mail: morten.madshus@ssb.no
tel.: (+47) 40 90 26 94