Content
Published:
This is an archived release.
No change in PIF
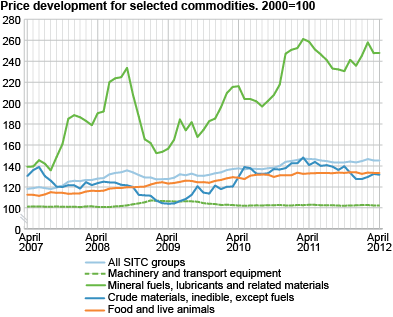
There was no change in the price index of first-hand domestic sales (PIF) from March to April. Chemicals contributed the most to the overall rise in the index, while the price falls in manufactured goods and crude materials pulled the PIF down to the zero level.
In April, the PIF was characterised by small rates of change in most product groups and varying price developments in the domestic and import markets. The price rise in the domestic market was counterbalanced by lower prices of imports and resulted in an unchanged PIF from March to April.
Chemicals and related products, as well as mineral fuels, lubricants and related materials were two important groups with price increases in April. Prices in these groups rose by 1.4 and 0.1 per cent respectively. The main reasons for the price increase in chemicals were higher prices of inorganic chemicals in the domestic market and of organic chemicals in the import market.
Electricity and gasoline up, crude oil down
The price rise in mineral fuels, lubricants and related materials was mainly due to higher electricity prices. On average, electricity prices were 0.6 per cent higher in April than the month before. Higher energy consumption in Norway and higher demand for Norwegian power in the neighbouring countries resulted in a rise in electricity prices in the first half of April. Prices in petroleum and petroleum products in the domestic market increased slightly due to a rise in gasoline prices. With regard to the import market, the prices in petroleum and petroleum products went down as a result of lower import prices of crude oil, diesel and marine gas oil.
Manufactured goods classified by materials and crude materials were two groups that experienced price declines from March to April and offset the price rise in chemicals and electricity. The overall price declines in these groups were 0.4 and 0.6 per cent respectively and were mainly caused by a decline in import prices.
Twelve-month change: down 0.9 per cent
The PIF decreased 0.9 per cent from April 2011 to April 2012. The largest contributors to the price decrease were mineral fuels, lubricants and related materials, as well as crude materials, where prices fell by 4.1 and 6.6 per cent respectively.
The main reason for the lower prices in mineral fuel, lubricants and related materials was lower electricity prices. Despite the rise in electricity prices from March to April, prices fell by as much as 28.6 per cent from April 2011 to April 2012. Prices of petroleum and petroleum products, however, were 4.8 per cent higher in April than a year ago. Lower prices of metalliferous ores and metal scrap in the import market were the main reason for the decline in prices for crude materials.
The price decline in the last 12 months was tempered by higher prices in chemicals. Prices in this group rose by 3.4 per cent due to higher prices of organic chemicals, dyeing, tanning and colouring materials.
| April 2012 | Changes, per cent | ||||||||||||||||||||||||||||||||||||||||||||||||||||||||||||||||||||||||||||||
|---|---|---|---|---|---|---|---|---|---|---|---|---|---|---|---|---|---|---|---|---|---|---|---|---|---|---|---|---|---|---|---|---|---|---|---|---|---|---|---|---|---|---|---|---|---|---|---|---|---|---|---|---|---|---|---|---|---|---|---|---|---|---|---|---|---|---|---|---|---|---|---|---|---|---|---|---|---|---|---|
|
March 2012-
April 2012 |
April 2011-
April 2012 |
||||||||||||||||||||||||||||||||||||||||||||||||||||||||||||||||||||||||||||||
| Total index | 145.3 | 0.0 | -0.9 | ||||||||||||||||||||||||||||||||||||||||||||||||||||||||||||||||||||||||||||
| Food and live animals | 133.3 | -0.1 | 0.4 | ||||||||||||||||||||||||||||||||||||||||||||||||||||||||||||||||||||||||||||
| Beverages and tobacco | 141.1 | 0.1 | 3.9 | ||||||||||||||||||||||||||||||||||||||||||||||||||||||||||||||||||||||||||||
| Crude materials, inedible, except fuels | 131.6 | -0.6 | -6.6 | ||||||||||||||||||||||||||||||||||||||||||||||||||||||||||||||||||||||||||||
| Mineral fuels, lubricants and related materials | 247.9 | 0.1 | -4.1 | ||||||||||||||||||||||||||||||||||||||||||||||||||||||||||||||||||||||||||||
| Chemicals and related products, n.e.s | 141.7 | 1.4 | 3.4 | ||||||||||||||||||||||||||||||||||||||||||||||||||||||||||||||||||||||||||||
| Manufactured goods classified by material | 131.4 | -0.4 | -1.1 | ||||||||||||||||||||||||||||||||||||||||||||||||||||||||||||||||||||||||||||
| Machinery and transport equipment | 102.2 | -0.1 | -0.7 | ||||||||||||||||||||||||||||||||||||||||||||||||||||||||||||||||||||||||||||
| Miscellaneous manufactured articles | 111.7 | 0.2 | 1.9 | ||||||||||||||||||||||||||||||||||||||||||||||||||||||||||||||||||||||||||||
Additional information
Contact
-
Producer price index
E-mail: produsentpris@ssb.no
tel.: (+47) 21 09 40 00
-
Elisabeth Mælum
E-mail: elisabeth.maelum@ssb.no
tel.: (+47) 97 01 28 49
-
Monika Græsli Engebretsen
E-mail: monika.graesli.engebretsen@ssb.no
tel.: (+47) 40 90 23 71
-
Morten Madshus
E-mail: morten.madshus@ssb.no
tel.: (+47) 40 90 26 94

