Content
Published:
This is an archived release.
Price jump in electricity
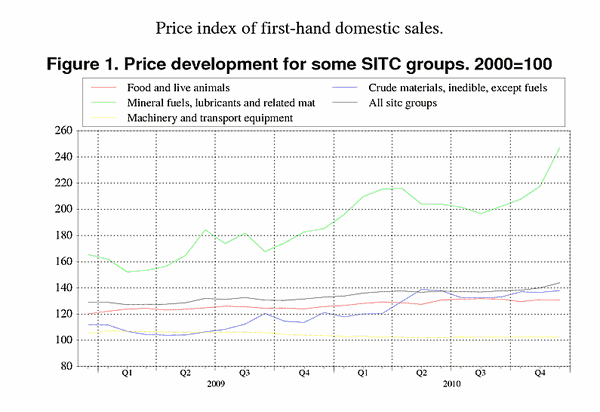
The price index of first-hand domestic sales increased by 2.7 per cent from November to December 2010, mainly due to higher prices of energy products, chemicals and related products, as well as crude materials, inedible, except fuels.
The price development from November to December was characterised by higher prices within all product groups, except for a small price fall for machinery and transport equipment and unchanged food prices. A price increase of 13.6 per cent for mineral fuels, lubricants and related materials made up the strongest contribution to the rise in the overall index from November to December, and electricity prices in particular had a strong influence, with a price rise of 31.2 per cent. A price increase within chemicals and related products as well as for crude materials (inedible, except fuels) also contributed, with a rise of 1.8 and 1.0 per cent respectively.
The price rise in the overall index from November to December was mainly caused by higher prices in the domestic market. The price increase of imported products was much lower and can be explained by stronger domestic currency compared to the Euro during this period.
Continued rise in the twelve-month rate
From December 2009 to December 2010, the price index of first-hand domestic sales went up 8.2 per cent. Electricity prices increased by 54 per cent and made up the strongest contribution to higher prices during these 12 months. A rise in prices of food products, crude materials, (inedible, except fuels), chemicals and related products, as well as manufactured goods, all had a strong influence on the total price change from December 2009 to December 2010.
2009 vs. 2010: increase of 5.9 per cent
From 2009 to 2010, the price index of first-hand domestic sales increased by 5.9 per cent, mainly due to higher prices of mineral fuels, lubricants and related materials, food products and crude materials, inedible, except fuels. (For more information see Annual change .)
The annual change of 23.5 per cent within mineral fuels, lubricants and related materials was mainly caused by higher electricity prices. From September to December 2010 electricity prices rose sharply, by 44 per cent. (For more information about electricity prices for 2010, see Producer price index .)
Annual change of 4.3 per cent for food products
Food products increased 4.3 per cent from 2009 to 2010, mainly caused by higher prices in the domestic market for fish and fish products, vegetables and fruits, as well as cereals and cereal preparations. The price rise in fish and fish products from 2009 to 2010 ended at approximately 10 per cent, and was the strongest contribution to higher food prices. One of the reasons behind higher fish prices is a growing demand for farmed salmon in the international market.
Prices within coffee, tea, cocoa and spices rose by 9.1 per cent from January to December 2010, and the annual change ended at 5.2 per cent for this product group and was mostly influenced by higher coffee prices in the import market.
Increasing international prices of cereals and cereal preparation have influenced the prices in the import market, while moderate price rises in the domestic market have lowered the total rise in prices of cereals and cereal preparation.
Crude materials, inedible, except fuels, rose by 18.5 per cent from 2009 to 2010, which is mainly caused by higher prices of metalliferous ores and metal scrap.
| December 2010 | Changes, per cent | ||||||||||||||||||||||||||||||||||||||||||||||||||||||||||||||||||||||||||||||
|---|---|---|---|---|---|---|---|---|---|---|---|---|---|---|---|---|---|---|---|---|---|---|---|---|---|---|---|---|---|---|---|---|---|---|---|---|---|---|---|---|---|---|---|---|---|---|---|---|---|---|---|---|---|---|---|---|---|---|---|---|---|---|---|---|---|---|---|---|---|---|---|---|---|---|---|---|---|---|---|
| November 2010-December 2010 | December 2009-December 2010 | ||||||||||||||||||||||||||||||||||||||||||||||||||||||||||||||||||||||||||||||
| Total index | 143.9 | 2.7 | 8.2 | ||||||||||||||||||||||||||||||||||||||||||||||||||||||||||||||||||||||||||||
| Food and live animals | 131.0 | 0.0 | 4.2 | ||||||||||||||||||||||||||||||||||||||||||||||||||||||||||||||||||||||||||||
| Beverages and tobacco | 135.4 | 0.7 | -0.9 | ||||||||||||||||||||||||||||||||||||||||||||||||||||||||||||||||||||||||||||
| Crude materials, inedible, except fuels | 137.9 | 1.0 | 13.7 | ||||||||||||||||||||||||||||||||||||||||||||||||||||||||||||||||||||||||||||
| Mineral fuels, lubricants and related materials | 247.1 | 13.6 | 33.4 | ||||||||||||||||||||||||||||||||||||||||||||||||||||||||||||||||||||||||||||
| Chemicals and related products, n.e.s | 132.7 | 1.8 | 4.3 | ||||||||||||||||||||||||||||||||||||||||||||||||||||||||||||||||||||||||||||
| Manufactured goods classified by material | 131.0 | 0.3 | 5.3 | ||||||||||||||||||||||||||||||||||||||||||||||||||||||||||||||||||||||||||||
| Machinery and transport equipment | 102.3 | -0.4 | -1.3 | ||||||||||||||||||||||||||||||||||||||||||||||||||||||||||||||||||||||||||||
| Miscellaneous manufactured articles | 109.4 | 0.1 | 0.7 | ||||||||||||||||||||||||||||||||||||||||||||||||||||||||||||||||||||||||||||
Additional information
Contact
-
Producer price index
E-mail: produsentpris@ssb.no
tel.: (+47) 21 09 40 00
-
Elisabeth Mælum
E-mail: elisabeth.maelum@ssb.no
tel.: (+47) 97 01 28 49
-
Monika Græsli Engebretsen
E-mail: monika.graesli.engebretsen@ssb.no
tel.: (+47) 40 90 23 71
-
Morten Madshus
E-mail: morten.madshus@ssb.no
tel.: (+47) 40 90 26 94

