Content
Published:
This is an archived release.
Price rise in oil and electricity
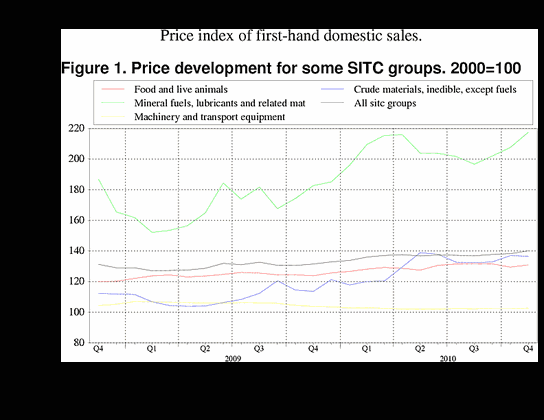
The price index of first-hand domestic sales increased by 1.3 per cent from October to November 2010. Prices of energy and food increased the most, while crude materials helped curb the price rise slightly in November.
Higher prices in mineral fuels, lubricants and related materials were the main reason why PIF increased from October to November. Price of crude oil (Brent Blend measured in NOK) rose further in November with a price increase of 5 per cent, compared with 3.1 per cent in October. Electricity prices rose by 6 per cent in November, partly because of higher prices of electricity sold to households and partly because of the higher system price at Nord Pool. The system price jumped up towards the end of the month and brought the average spot price from Nord Pool to an 11 per cent higher level than in October. The sharp rise in electricity prices at the end of November was due to a decrease in Norwegian water reservoir levels, and the cold weather and high consumption of electricity.
The price rise in food of 1.2 per cent comes mainly from three groups; meat and meat products, fish and fish products, and vegetables and fruits. Meat and fish prices rose by 1.2 and 1.4 per cent respectively, and this price rise was entirely due to higher prices in the domestic market. Vegetables and fruits were 4.7 per cent more expensive in November, largely because of the rise in import prices of fruits.
Prices in crude materials (inedible) except fuels fell by 0.3 per cent due to lower prices of metalliferous ores and metal scrap in the import market, and wood, lumber and cork, and pulp and waste paper in the domestic market. However, despite the crude material price fall in November, the prices were still only about 2 per cent lower than in June 2007, when they were at a historically high level.
Twelve-month change: 6.5 per cent higher prices
The PIF rose by 6.5 per cent from November 2009 to November 2010. All product groups except machinery and transport equipment, as well as beverages and tobacco have higher prices this year compared with last year.
Mineral fuels, lubricants and related materials increased by 19.0 per cent and played the largest role in bringing the twelve-month change in the PIF up. Despite the price decline in crude materials last month, the crude material prices rose by 20.2 per cent from November 2009 to November 2010.
Food is 5.7 per cent more expensive this year than last year. The price rise in fish and fish products was as high as 13.8 per cent, while vegetables and fruits were 10.1 per cent more expensive this year than last year. The price rise in these two food groups was greatest in the domestic and import market respectively.
| November 2010 | Changes, per cent | ||||||||||||||||||||||||||||||||||||||||||||||||||||||||||||||||||||||||||||||
|---|---|---|---|---|---|---|---|---|---|---|---|---|---|---|---|---|---|---|---|---|---|---|---|---|---|---|---|---|---|---|---|---|---|---|---|---|---|---|---|---|---|---|---|---|---|---|---|---|---|---|---|---|---|---|---|---|---|---|---|---|---|---|---|---|---|---|---|---|---|---|---|---|---|---|---|---|---|---|---|
| October 2010-November 2010 | November 2009-November 2010 | ||||||||||||||||||||||||||||||||||||||||||||||||||||||||||||||||||||||||||||||
| Total index | 140.1 | 1.3 | 6.5 | ||||||||||||||||||||||||||||||||||||||||||||||||||||||||||||||||||||||||||||
| Food and live animals | 131.0 | 1.2 | 5.7 | ||||||||||||||||||||||||||||||||||||||||||||||||||||||||||||||||||||||||||||
| Beverages and tobacco | 134.5 | -0.4 | -1.6 | ||||||||||||||||||||||||||||||||||||||||||||||||||||||||||||||||||||||||||||
| Crude materials, inedible, except fuels | 136.6 | -0.3 | 20.2 | ||||||||||||||||||||||||||||||||||||||||||||||||||||||||||||||||||||||||||||
| Mineral fuels, lubricants and related materials | 217.6 | 4.8 | 19.0 | ||||||||||||||||||||||||||||||||||||||||||||||||||||||||||||||||||||||||||||
| Chemicals and related products, n.e.s | 130.3 | 1.1 | 2.9 | ||||||||||||||||||||||||||||||||||||||||||||||||||||||||||||||||||||||||||||
| Manufactured goods classified by material | 130.6 | 0.3 | 5.7 | ||||||||||||||||||||||||||||||||||||||||||||||||||||||||||||||||||||||||||||
| Machinery and transport equipment | 102.7 | 0.2 | -1.2 | ||||||||||||||||||||||||||||||||||||||||||||||||||||||||||||||||||||||||||||
| Miscellaneous manufactured articles | 109.3 | 0.4 | 0.9 | ||||||||||||||||||||||||||||||||||||||||||||||||||||||||||||||||||||||||||||
Additional information
Contact
-
Producer price index
E-mail: produsentpris@ssb.no
tel.: (+47) 21 09 40 00
-
Elisabeth Mælum
E-mail: elisabeth.maelum@ssb.no
tel.: (+47) 97 01 28 49
-
Monika Græsli Engebretsen
E-mail: monika.graesli.engebretsen@ssb.no
tel.: (+47) 40 90 23 71
-
Morten Madshus
E-mail: morten.madshus@ssb.no
tel.: (+47) 40 90 26 94

