Content
Published:
This is an archived release.
Price decrease in energy products
The price index of first-hand domestic sales (PIF) decreased by 0.2 per cent from July to August 2010, while higher prices of manufactured goods, classified by material, diminished the decline in the overall index.
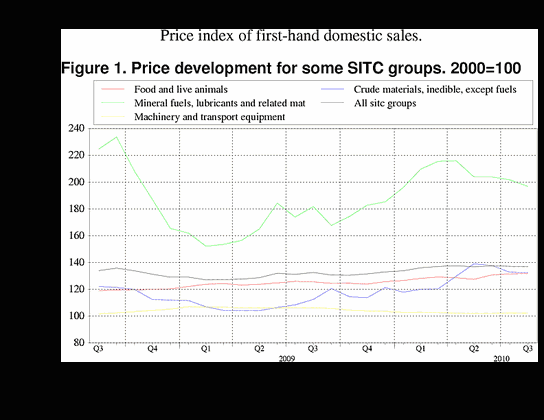
Prices within mineral fuels, lubricants and related materials fell 2.4 per cent from July to August, mainly because of lower prices of petroleum and petroleum products and falling electricity prices. The price of crude oil, Brent blend measured in NOK, fell 1.3 per cent during this period, while the prices of electricity decreased by 3.6 per cent. The decline in the index for electricity was caused by lower system prices from Nord Pool as well as lower prices of electricity sold to households.
Prices of manufactured goods increased by 0.9 per cent, which was mainly caused by higher prices of metals.
Prices of food products remained nearly unchanged from July to August, up 0.2 per cent. The biggest contribution to this increase came from higher prices in both import and domestic prices of fish and fish products, and from higher import prices of cereals and cereals preparations together with vegetables and fruits. Lower prices of vegetables and fruits and meat produced in Norway lowered the total increase for food products.
Twelve-month change 3.2 per cent increase
From August 2009 to August 2010, the PIF increased by 3.2 per cent. There was price rise in almost every product group, with the exception of declining prices within machinery and transport equipment and miscellaneous manufactured articles. Higher prices of mineral fuels, lubricants and related materials, increasing prices of crude materials, inedible, except fuels and rising food prices made the largest contribution to the 3.2 per cent increase in the twelve-month change in this period. Here prices increased by 8.3, 17.8 and 4.8 per cent respectively. The price increase of 3.9 per cent on manufactured goods came largely from higher import prices.
Prices of machinery and transport equipment and miscellaneous manufactured articles dropped 3.7 and 0.5 per cent respectively. Almost every product group within machinery and transport equipment was reduced during this twelve month period.
| August 2010 | Changes, per cent | ||||||||||||||||||||||||||||||||||||||||||||||||||||||||||||||||||||||||||||||
|---|---|---|---|---|---|---|---|---|---|---|---|---|---|---|---|---|---|---|---|---|---|---|---|---|---|---|---|---|---|---|---|---|---|---|---|---|---|---|---|---|---|---|---|---|---|---|---|---|---|---|---|---|---|---|---|---|---|---|---|---|---|---|---|---|---|---|---|---|---|---|---|---|---|---|---|---|---|---|---|
| July 2010-August 2010 | August 2009-August 2010 | ||||||||||||||||||||||||||||||||||||||||||||||||||||||||||||||||||||||||||||||
| Total index | 136.9 | -0.2 | 3.2 | ||||||||||||||||||||||||||||||||||||||||||||||||||||||||||||||||||||||||||||
| Food and live animals | 131.7 | 0.2 | 4.8 | ||||||||||||||||||||||||||||||||||||||||||||||||||||||||||||||||||||||||||||
| Beverages and tobacco | 138.2 | 2.6 | 1.8 | ||||||||||||||||||||||||||||||||||||||||||||||||||||||||||||||||||||||||||||
| Crude materials, inedible, except fuels | 132.4 | -0.2 | 17.8 | ||||||||||||||||||||||||||||||||||||||||||||||||||||||||||||||||||||||||||||
| Mineral fuels, lubricants and related materials | 196.8 | -2.4 | 8.3 | ||||||||||||||||||||||||||||||||||||||||||||||||||||||||||||||||||||||||||||
| Chemicals and related products, n.e.s | 128.7 | 0.1 | 0.3 | ||||||||||||||||||||||||||||||||||||||||||||||||||||||||||||||||||||||||||||
| Manufactured goods classified by material | 129.4 | 0.9 | 3.9 | ||||||||||||||||||||||||||||||||||||||||||||||||||||||||||||||||||||||||||||
| Machinery and transport equipment | 102.3 | -0.1 | -3.7 | ||||||||||||||||||||||||||||||||||||||||||||||||||||||||||||||||||||||||||||
| Miscellaneous manufactured articles | 108.8 | -0.1 | -0.5 | ||||||||||||||||||||||||||||||||||||||||||||||||||||||||||||||||||||||||||||
Additional information
Contact
-
Producer price index
E-mail: produsentpris@ssb.no
tel.: (+47) 21 09 40 00
-
Elisabeth Mælum
E-mail: elisabeth.maelum@ssb.no
tel.: (+47) 97 01 28 49
-
Monika Græsli Engebretsen
E-mail: monika.graesli.engebretsen@ssb.no
tel.: (+47) 40 90 23 71
-
Morten Madshus
E-mail: morten.madshus@ssb.no
tel.: (+47) 40 90 26 94

