Content
Published:
This is an archived release.
Fall in energy prices
The price index of first-hand domestic sales had a 1.4 per cent decline from September to October 2008. Electricity prices and prices of petroleum and petroleum products both fell more than eleven per cent. Prices for non-ferrous metals had a 7.2 per cent drop from September to October.
A fall in the electricity price and the prices of petroleum and petroleum products caused a 1.4 per cent decline in the price index of first-hand domestic sales from September to October 2008. Prices of petroleum and petroleum products went down for the forth month in a row, the decline from September to October (down 11.5 per cent) was stronger than that from August to September (down 4.5 per cent). Electricity prices fell for the first time since May 2008.
The strongest price decline among other goods was for non-ferrous metals, whose prices went down by 7.2 per cent. Here, the import prices had the steepest fall. Prices of crude materials (inedible, except fuels) went down from September to October. The most important contribution to this decline was metalliferous ores and metal scrap, prices here went down by 2.8 per cent.
Also other groups of goods saw prices rise from September to October. Iron and steel prices went up 2.1 per cent, while prices of other manufactures of metals rose by 1.7 per cent. Prices of machinery and transport equipment as well as miscellaneous manufactured articles went up by one per cent.
Twelve month change: Price rise of 10.5 per cent
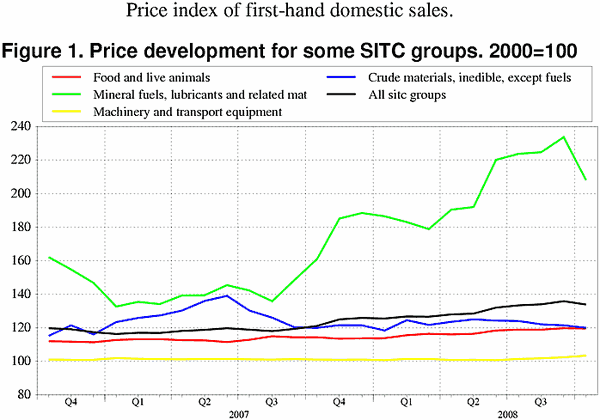
The twelve month growth in the price index of first-hand domestic sales for October 2008 was 10.5 per cent, down from 13.7 per cent in September. Prices of mineral fuels, lubricants and related materials went up with 29.4 per cent from October 2007 to October 2008, while animal and vegetable oils, fats and waxes had a growth in prices of 35.4 per cent for the same period. Prices of chemicals and related products rose by 22 per cent from October 2007 to October 2008.
| October 2008 | Changes, per cent | ||||||||||||||||||||||||||||||||||||||
|---|---|---|---|---|---|---|---|---|---|---|---|---|---|---|---|---|---|---|---|---|---|---|---|---|---|---|---|---|---|---|---|---|---|---|---|---|---|---|---|
|
September 2008-
October 2008 |
October 2007-
October 2008 |
||||||||||||||||||||||||||||||||||||||
| Total index | 133.8 | -1.4 | 10.5 | ||||||||||||||||||||||||||||||||||||
| Food and live animals | 119.6 | 0.0 | 4.7 | ||||||||||||||||||||||||||||||||||||
| Beverages and tobacco | 126.4 | 0.7 | 6.0 | ||||||||||||||||||||||||||||||||||||
| Crude materials, inedible, except fuels | 119.9 | -1.3 | 0.0 | ||||||||||||||||||||||||||||||||||||
| Mineral fuels, lubricants and related materials | 208.2 | -10.9 | 29.4 | ||||||||||||||||||||||||||||||||||||
| Chemicals and related products, n.e.s | 134.3 | 2.2 | 22.0 | ||||||||||||||||||||||||||||||||||||
| Manufactured goods classified by material | 126.7 | 0.4 | 9.6 | ||||||||||||||||||||||||||||||||||||
| Machinery and transport equipment | 103.4 | 1.0 | 2.4 | ||||||||||||||||||||||||||||||||||||
| Miscellaneous manufactured articles | 106.1 | 1.0 | 3.1 | ||||||||||||||||||||||||||||||||||||
Additional information
Contact
-
Producer price index
E-mail: produsentpris@ssb.no
tel.: (+47) 21 09 40 00
-
Elisabeth Mælum
E-mail: elisabeth.maelum@ssb.no
tel.: (+47) 97 01 28 49
-
Monika Græsli Engebretsen
E-mail: monika.graesli.engebretsen@ssb.no
tel.: (+47) 40 90 23 71
-
Morten Madshus
E-mail: morten.madshus@ssb.no
tel.: (+47) 40 90 26 94