Content
Published:
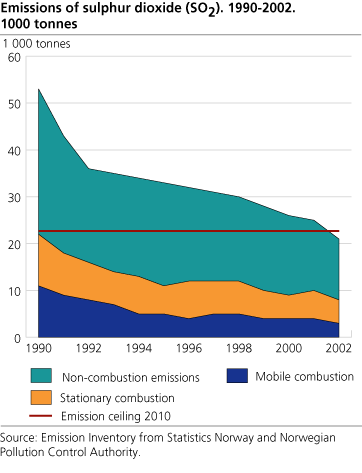
Sulphur emissions reduced since 1990
Norwegian emissions of sulphur dioxide have now reached the level of the obligation in the Gothenburg protocol. The emissions are reduced by 58 per cent since 1990, and by 10 per cent from 2001 to 2002. The emissions of ammonia are also below the limit of the obligation.
This is shown in the emission figures Statistics Norway (SSB) has calculated in collaboration with the Norwegian Pollution Control Authority (SFT).
In 2002 the emissions of sulphur dioxide (SO2) were slightly greater than 22 000 tonnes. This is on the level of the Norwegian obligation in the Gothenburg protocol. Since 1990 the emissions have been reduced by 58 per cent. From 2001 to 2002 the emissions were reduced by 10 per cent. The reduction was mainly due to lower activity in the production of iron, steel and ferroalloys. Other parts of the manufacturing industries and domestic shipping have also had considerable reduction. Since the reduction in the emissions partly is due to lowered economic activity in 2002, is it uncertain if emissions will stay on the 2002 level for the coming years.
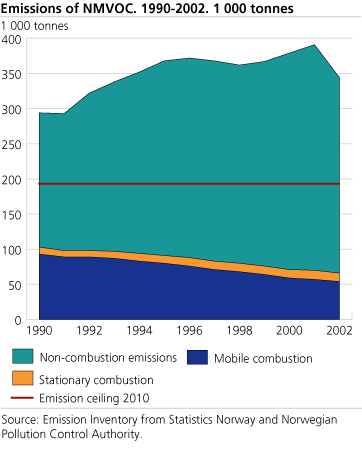
NMVOC emissions are reduced
After an increase during most of the 1990s, the emissions of non-methane volatile organic compounds (NMVOCs) have decreased the last years. In 2002 the emissions of NMVOC were calculated to 345 000 tonnes. The emissions are still higher than the Norwegian obligation in the Geneva protocol, which is 248 000 tonnes and which should have been reached in 1999. It is expected that the obligation in the Geneva protocol will be reached in 2005.
The reduction by 12 per cent compared to 2001 is due to lower amounts of crude oil loaded offshore, and the fact that recovery facilities for oil vapour have been installed. Decrease in petrol sales and more cars with catalytic converters give further reduction in the emissions.
Loading of crude oil is dominating
In 2002, more than 50 per cent of Norway's NMVOC emissions came from evaporation during loading and storing of crude oil offshore. The Norwegian Pollution Control Authority (SFT) has given injunction to reduce these emissions considerably. The undertakings shall be made in the period 2003-2007.
The planned undertakings for reducing the emissions from loading and storage of crude oil will lead to Norway's successful attainment of its obligation under the Gothenburg protocol of not exceeding 195 000 tonnes in 2010.
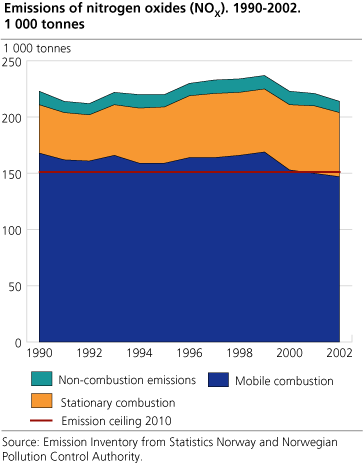
In accordance with the Gothenburg protocol Norway is obliged to reduce the emissions of nitrogen oxides (NOX) to 156 000 tonnes in 2010. In other words a decrease of 27 per cent compared to the current level.
In 2002, the emissions of nitrogen oxides were reduced by 3 per cent compared to 2001. The sources that contribute most to the decrease are road traffic, oil and gas activities and manufacturing industry.
NOX emissions have been reduced in spite of the rise in road traffic. This is due to a rise in the use of catalytic converters.
Reduction in flaring of natural gas offshore during 2002, has led to lower NOX emissions. The emissions in parts of the process industry have also been reduced because of reduced activity and plant closures.
In some fields, however, NOX emissions are increasing. The growth in use of natural gas for production of electricity on oil platforms contributes to increased emissions. This is due to an increase in the production of crude oil, gas and gas liquids.
The emissions from shipping have been at approximately the same level from 1990 until today. Domestic shipping and fishing vessels were responsible for 40 per cent of the NOX emissions in Norway in 2002. Road traffic contributed to 21 per cent and the oil and gas activities offshore 21 per cent, while 10 per cent of the emissions are due to processes and combustion in the manufacturing industry. International shipping and aviation are not included in the official statistics over NOX emissions, since these sources are not included in international environmental obligations.
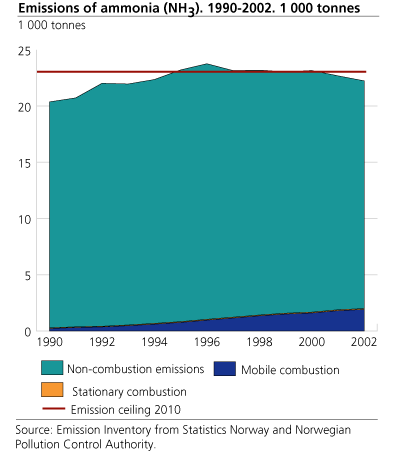
Ammonia emissions lower than the obligation
The Norwegian emissions of ammonia are now below the level that we are obliged to keep in 2010 due to the Gothenburg protocol. New calculations show that the Norwegian emissions of ammonia are 10 per cent lower than according to earlier calculations.
The new updated calculations show that the emissions of ammonia increased by 9 per cent during the period 1990-2002 to 22 200 tonnes. In 2002 however, the emissions decreased 2 per cent compared with the year before. For the years 2001 and 2002 the emissions were calculated to be below the emission ceiling on 23 000 tonnes. Under the Gothenburg protocol Norway is obliged to keep this emission ceiling from 2010. Agriculture contributed with 89 per cent of the emissions in 2002, petrol cars with 9 per cent and process emissions from the manufacturing industry with 2 per cent.
Ammonia was overestimated
In accordance with the CLRTAP convention, all time series with emission data shall be recalculated annually to consider new knowledge and to correct possible errors. Statistics Norway has in cooperation with the Agricultural University of Norway (NLH) made improvements in the calculation model for ammonia emissions from the agricultural sector. The recalculated data has given emission figures that are about 10 per cent lower in the period 1990-2002 than earlier calculated. Statistics Norway made a detailed manure survey in 2000, that gave more extended activity data that was better related to emission source categories, for manure management and spreading. New loss factors for different manure management categories are also used in the revised NH3-model, that are more connected to specific activities. It was also found an error in the old NH3-model in the module calculating emission of NH3 from synthetic fertiliser.
|
Emission ceiling 2010 according to the Gothenburg
Protocol. Status 2002. Tonnes (per cent) |
| Component | Emissions 1990 | Emissions 2002 |
Emission
ceiling 2010 |
||||||||||||||||||||||||||||||||||||
|---|---|---|---|---|---|---|---|---|---|---|---|---|---|---|---|---|---|---|---|---|---|---|---|---|---|---|---|---|---|---|---|---|---|---|---|---|---|---|---|
| Nitrogen oxides | 223 725 | 212 978 | 156 000 | ||||||||||||||||||||||||||||||||||||
| NMVOC | 294 395 | 344 903 | 195 000 | ||||||||||||||||||||||||||||||||||||
| Sulphur dioxide (SO2) | 52 295 | 22 074 | 22 000 | ||||||||||||||||||||||||||||||||||||
| Ammonia (NH3) | 20 375 | 22 244 | 23 000 | ||||||||||||||||||||||||||||||||||||
2003 emission figures soon to be presented
Today are also new figures for emissions to air of greenhouse gases and persistent organic pollutants and heavy metals presented. Links to the articles are found below. The 1s t of April preliminary national air emission figures for 2003 will be presented. Emission figures for municipalities for greenhouse gases 1991, 1995, 2000 and 2001 and for other gases 2001 will be presented the 1st of March.
Read more (in Norwegian) about the international environmental obligations Norway has signed in this field.
Other articles on emission to air:
SSB 13.02.2004 : Up and down since 1996
SSB 13.02.2004: Emission of heavy metals down
Tables in the StatBank .
Tables:
The statistics is published with Emissions to air.
Contact
-
Statistics Norway's Information Centre
E-mail: informasjon@ssb.no
tel.: (+47) 21 09 46 42