Content
Published:
This is an archived release.
More waste was burnt
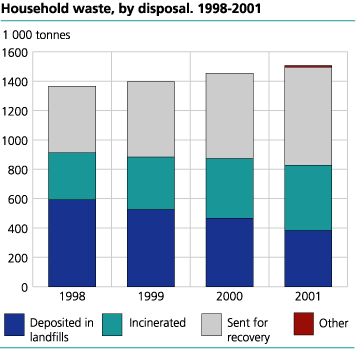
In 2001 Norwegian households for the first time delivered more waste for incineration than they sent to landfills. 29 per cent of the household waste was incinerated, whereas 25 per cent was landfilled.
47 per cent more household waste was sorted out for recovery in 2001 than in 1998. In the same period, household waste landfilled decreased by 35 per cent and incineration increased by 39 per cent. In all, 1.5 million tons of household waste was collected, which is 56 000 tonnes, or 4 per cent, more than the year before.
The amount of waste is still increasing...
Increases in the amount of household waste have been registered ever since the first investigations were done at the beginning of the 1970s. In 1974 each person delivered on average 174 kilos of household waste. The corresponding figure was 335 kilos in 2001. This is 11 kilos more than in 2000.
...but less goes into landfills...
In 2000 Norwegian households for the first time sorted out more household waste for recycling than they sent to landfills. In 2001 the amount sent to landfills dropped even further and was surpassed also by incineration. Approximately 25 per cent of household waste was delivered directly to landfills. For 2001 this corresponds to 382 000 tonnes, or 85 kilos from every Norwegian. This is a decrease of 85 000 tonnes, or 18 per cent, from 2000. In 2001 about 445 000 tonnes of household waste was incinerated, an increase of 39 000 tonnes since 2000. This corresponds to 99 kg per inhabitant.
In 1999 the average energy utilisation at Norwegian waste incineration plants was 73 per cent. If energy utilisation remained the same in 2001, 323 000 tonnes of residual waste from households was utilised for energy in 2000. This means that 67 per cent of household waste is utilised by means of either recycling or energy recovery, and 33 per cent goes for final treatment. This is 7 percentage points closer to the waste policy target of 25 per cent final treatment before 2010 than Norway was in 2000. These calculations do not take into account the fact that some of the sorted waste is rejected by the recovery process and ends up in landfills or incinerated. The true percentage going to final treatment is thus somewhat higher. One should also note that the target of 25 per cent final treatment applies to all waste, and not just household waste. The waste final treatment tax which was imposed January 1. 1999, probably has contributed to the observed trend. During the last couple of years, a number of new waste incineration plants have had considerable effect on the waste handling practice in Norway.
...and we sort more
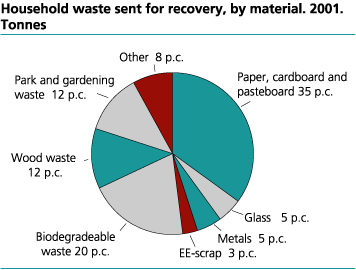
We are sorting more and more. Of the 1.5 million tonnes household waste collected last year, 668 000 tonnes were sorted for recovery. On average each Norwegian sorted 149 kilos of waste in 2001 compared with 130 in 2000. For most of the years in the 1990s the increase in the amount of household waste being sorted was greater than the total increase in the amount of household waste. This trend is continuing. Although the trend is continuing for all materials, in tonnes it was biodegradables that increased the most from 1998 to 2001.
Here sorted for recovery means the waste that each household sorts at home or that is sorted at waste disposal plants. After sorting, the waste may be subject to material recovery, incinerated for energy or used as landfill. After such treatment there may be residue that in most places is disposed of in landfills. Waste from waste treatment is considered industrial waste.
In connection with collecting waste by waste collection vehicle or at receiving stations, it can be difficult to register private waste and industrial waste separately. It is also the case that municipalities have difficulty keeping track of the amount of waste generated in a particular municipality that is disposed of or delivered to municipal plants in surrounding municipalities or private companies. The figures are corrected for both these situations to a certain extent.
Better waste collection service
All municipalities in Norway now have a kind of recycling scheme. On average, Norwegian households have three waste containers at home, two for certain material fractions, which vary from municipality to municipality, and one for the rest of the waste. The most common material fractions for sorting at home are paper, which is collected in 385 out of 435 municipalities, and biodegradables, which is collected in 278 municipalities. Corresponding figures for 1997 were 283 and 134 municipalities respectively. Hazardous waste was collected at home or at receiving stations (bring/drop off-sites) in 415 municipalities in 2001. 27 municipalities had no separate waste collection at home in 2001. The corresponding figure for 1997 was 136.
|
Houshold waste in total and sent for recovery. 1992-2001.
Tonnes and kilo per inhabitant |
| The whole country | Total | Sent for recovery | |||||||||||||||||||||||||||||||||||||
|---|---|---|---|---|---|---|---|---|---|---|---|---|---|---|---|---|---|---|---|---|---|---|---|---|---|---|---|---|---|---|---|---|---|---|---|---|---|---|---|
| Total | Kilo per inhabitant | Total | Kilo per inhabitant | ||||||||||||||||||||||||||||||||||||
| 19921 | 1 012 192 | 237 | 86 363 | 20 | |||||||||||||||||||||||||||||||||||
| 19951 | 1 173 643 | 269 | 212 689 | 49 | |||||||||||||||||||||||||||||||||||
| 19961 | 1 195 274 | 274 | 260 234 | 60 | |||||||||||||||||||||||||||||||||||
| 19971 | 1 259 333 | 287 | 365 898 | 83 | |||||||||||||||||||||||||||||||||||
| 1998 | 1 363 909 | 309 | 452 698 | 102 | |||||||||||||||||||||||||||||||||||
| 1999 | 1 396 674 | 314 | 524 156 | 118 | |||||||||||||||||||||||||||||||||||
| 2000 | 1 451 590 | 324 | 581 056 | 130 | |||||||||||||||||||||||||||||||||||
| 2001 | 1 506 715 | 335 | 668 393 | 148 | |||||||||||||||||||||||||||||||||||
| 1 | The figures are scaled down to correct for interference of waste from the industries. |
| Source: Avfallsstatistikk, Statistisk sentralbyrå. | |
The figures are from a census that Statistics Norway conducted in all municipalities and inter-municipal waste management companies in Norway excl. Svalbard.
More information: eva.vinju@ssb.no , tel. +47 62 88 54 76, or svein.erik.stave@ssb.no , tel. +47 62 88 55 38.
Tables:
- Table 1 Household waste. 1974-2001. Kilo per person
- Table 2 Houshold waste, by county. 1995, 1998 and 2001. Kilo per inhabitant
- Table 3 Household waste sent for recovery, by material. Percentage of total household waste sent for recovery. 1992-2001. Tonnes
- Table 4 Household waste sent for recovery. 1992-2001. 1 000 tonnes
- Table 5 Househuld waste, by municipality. 1992-2001. Kilo per person
- Table 6 Household waste sent for recovery, by material. Percentage of total household waste sent for recovery. County and municipality. 2001. Tonnes
- Table 7 Houshold waste, by disposal. 1992-2001. 1000 tonnes
Contact
-
Camilla Skjerpen
E-mail: camilla.skjerpen@ssb.no
tel.: (+47) 48 22 72 14
-
Mona E. Onstad
E-mail: mona.onstad@ssb.no
tel.: (+47) 48 59 61 86


