Content
Published:
This is an archived release.
More manufacturing waste to recovery
Of all waste from Norwegian manufacturing industries, around three quarters was sent to recovery; either material recovery or incineration.
The results show that 17 per cent of the 2.3 million tonnes of waste from manufacturing were placed in landfills and 10 per cent was used for landscaping and backfilling.
Error in the data for 2003
The total amount of waste from manufacturing industries in 2003 shall be 2,7 million tonnes, and not 3,1 million, that are used in the comparison in this article.
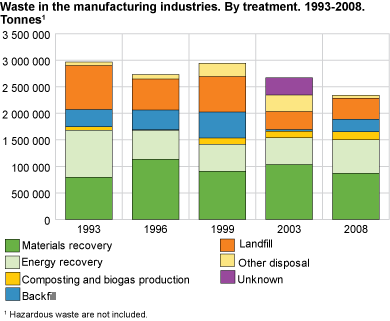
Waste sent to material recovery decreased from 2003 to 2008, with the largest decrease in paper and board. At the same time, the total amount of paper and board waste decreased by 70 per cent compared with 2003. Because paper and board have a high rate of recovery, the drop in amounts for this material will reduce the overall rate of recovery.
About a third of all waste was incinerated with energy recovery. In 2008, around 63 per cent of the 820 million tonnes of wood waste was incinerated.
A total of 393 000 tonnes of waste were deposited on landfills. Half of this was cinders, dust, ashes and other mineral wastes. Around 80 per cent of the 235 000 tonnes used for landscaping and backfilling was made up of cinders, dust, ashes and other mineral wastes.
Publishing, printing and reproduction industries topped the list for recovery, with 92 per cent. Manufacturing of rubber and plastic products had the lowest rate of recovery.
Sources of error and uncertaintyThe data for 2008 is based on a sample survey where 1 800 companies of a total of 17 000 are in the sample. The same sampling method is used for the years 1996, 1999 and 2003. The majority of the largest companies are included, whilst the small companies are represented to a lesser degree. For the years in between, the calculation for the amount of waste is based on a simple question for total waste amount sent to a sample of companies.
Uncertainties will occur in sample surveys because some companies with large amounts of waste may be missing.
With regard to the manufacturing companies, it can, to some extent, be difficult to distinguish between waste and by-product, which can explain some of the fluctuations in the waste amounts from 2003 to 2008. The manufacturing industry can define some of the waste as a by-product even if it should be included as waste in the statistics. The regulations for waste, which include definitions, are under revision, and the result of this might influence future waste statistics. |
Contact
-
Manju Chaudhary
E-mail: manju.chaudhary@ssb.no
tel.: (+47) 99 58 02 06
-
Mona E. Onstad
E-mail: mona.onstad@ssb.no
tel.: (+47) 48 59 61 86
-
Camilla Skjerpen
E-mail: camilla.skjerpen@ssb.no
tel.: (+47) 48 22 72 14