Content
Published:
This is an archived release.
Decrease in manufacturing waste
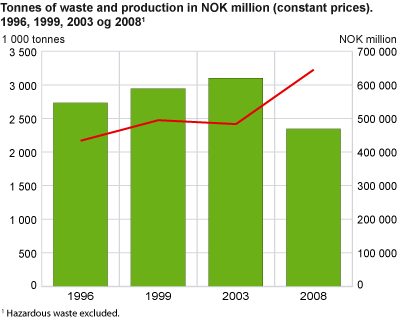
The amount of waste from Norwegian manufacturing industries has dropped, and was about 2.3 million tonnes in 2008. This is the first reduction since the waste statistics from manufacturing industries started in 1993. Manufacturing waste equals a quarter of the national total. In the same period, manufacturing production rose by 33 per cent.
The results show that ordinary waste was down by 24 per cent from 2003 to 2008. Hazardous waste is not included in these statistics.
Variation between the industries
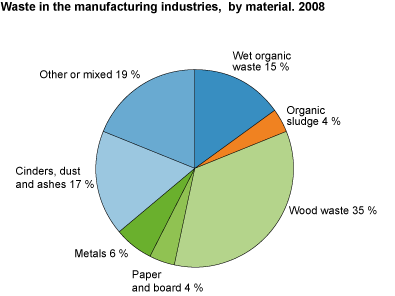
The waste materials from manufacturing are strongly related to the industry that generates the waste. In 2008, the production of wood and wood products topped the list of waste generation, with 622 000 tonnes. This was the only industry with an increase from 2003. Wood is still the most abundant material in manufacturing waste, accounting for 35 per cent. About 75 per cent of the wood waste is generated in wood industries.
| 1996 | 1999 | 2003 | 2008 | ||||||||||||||||||||||||||||||||||||||||||||||||||||||||||||||||||||||||||||
|---|---|---|---|---|---|---|---|---|---|---|---|---|---|---|---|---|---|---|---|---|---|---|---|---|---|---|---|---|---|---|---|---|---|---|---|---|---|---|---|---|---|---|---|---|---|---|---|---|---|---|---|---|---|---|---|---|---|---|---|---|---|---|---|---|---|---|---|---|---|---|---|---|---|---|---|---|---|---|---|
| The whole country | 6,3 | 5,9 | 6,4 | 3,6 | |||||||||||||||||||||||||||||||||||||||||||||||||||||||||||||||||||||||||||
| Industri | |||||||||||||||||||||||||||||||||||||||||||||||||||||||||||||||||||||||||||||||
| Food products, beverages and tobacco | 6.0 | 5.5 | 6.7 | 4.0 | |||||||||||||||||||||||||||||||||||||||||||||||||||||||||||||||||||||||||||
| Textiles,wearing apparel, leather | 1.7 | 1.6 | 1.3 | 0.9 | |||||||||||||||||||||||||||||||||||||||||||||||||||||||||||||||||||||||||||
| Wood and wood products | 38.8 | 25.8 | 25.0 | 29.4 | |||||||||||||||||||||||||||||||||||||||||||||||||||||||||||||||||||||||||||
| Pulp, paper and paper products | 21.6 | 21.0 | 23.0 | 15.2 | |||||||||||||||||||||||||||||||||||||||||||||||||||||||||||||||||||||||||||
| Publishing, printing, reproduction | 2.0 | 2.1 | 3.6 | 1.5 | |||||||||||||||||||||||||||||||||||||||||||||||||||||||||||||||||||||||||||
| Refined petroleum, chemical and mineral products | 0.1 | 0.1 | 0.1 | 0.0 | |||||||||||||||||||||||||||||||||||||||||||||||||||||||||||||||||||||||||||
| Basic chemicals | 3.9 | 5.2 | 5.4 | 2.0 | |||||||||||||||||||||||||||||||||||||||||||||||||||||||||||||||||||||||||||
| Basic metals | 17.1 | 13.2 | 8.8 | 8.2 | |||||||||||||||||||||||||||||||||||||||||||||||||||||||||||||||||||||||||||
| Machinery and other equipment n.e.c. | 0.6 | 0.7 | 0.4 | 0.2 | |||||||||||||||||||||||||||||||||||||||||||||||||||||||||||||||||||||||||||
| Building of ships, oil platforms and moduls | 2.1 | 1.1 | 0.9 | 0.7 | |||||||||||||||||||||||||||||||||||||||||||||||||||||||||||||||||||||||||||
| Furniture and other manufacturing n.e.c. | 4.0 | 2.1 | 1.8 | 0.7 | |||||||||||||||||||||||||||||||||||||||||||||||||||||||||||||||||||||||||||
| 1 | Waste from recycling industries are not included. |
| Source: Waste statistics, Statistics Norway. | |
The food processing industries have reduced the waste amount from 761 000 tonnes in 2003 to 495 000 tonnes in 2008. At the same time, the production has increased by 28 per cent. The food processing industries accounted for 97 per cent of the wet organic waste.
Publishing, printing and reproduction industries have halved the amounts from 2003 to 2008. One of the reasons for this can be that the publishing industries are no longer included as manufacturing industries.
Sources of error and uncertaintyThe data for 2008 is based on a sample survey where 1 800 companies of a total of 17 000 are in the sample. The same sampling method is used for the years 1996, 1999 and 2003. The majority of the largest companies are included, whilst the small companies are represented to a lesser degree. For the years in between, the calculation for the amount of waste is based on a simple question for total waste amount sent to a sample of companies. Uncertainties will occur in sample surveys because some companies with large amounts of waste may be missing. With regard to the manufacturing companies, it can, to some extent, be difficult to distinguish between waste and by-product, which can explain some of the fluctuations in the waste amounts from 2003 to 2008. The manufacturing industry can define some of the waste as a by-product even if it should be included as waste in the statistics. The regulations for waste, which includes definitions, are under revision, and the result of this might influence future waste statistics. |
Contact
-
Manju Chaudhary
E-mail: manju.chaudhary@ssb.no
tel.: (+47) 99 58 02 06
-
Mona E. Onstad
E-mail: mona.onstad@ssb.no
tel.: (+47) 48 59 61 86
-
Camilla Skjerpen
E-mail: camilla.skjerpen@ssb.no
tel.: (+47) 48 22 72 14


