Content
Published:
This is an archived release.
Lower rise in waste than production
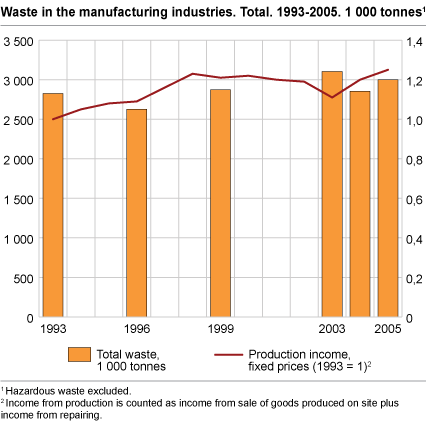
In 2005, Norwegian manufacturing industries generated 3 million tonnes of waste. This is an increase of 6 per cent since 1993. In the same period, manufacturing production rose by 25 per cent. The amount of waste in the food processing industries has increased considerably, while the opposite is the case for the wood industries.
Manufacturing waste equals 36 per cent of the national total (hazardous waste not included). More than 90 per cent of the waste in manufacturing was waste from production processes.
Decline in waste in wood industries
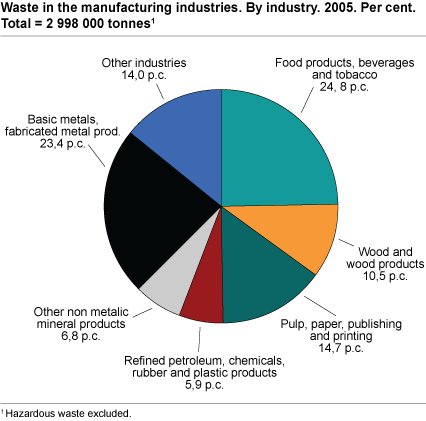
The wood and wood product industries have reduced waste generation by 50 per cent from 1996 to 2005. In the same period, income from production increased by 16 per cent in fixed prices. This may indicate a shift towards less waste-generating production processes or a more effective on-site recycling of production waste into products. In 1996, the wood industries topped the list of waste generators, but nine years later these industries contributed to only 10 per cent of the total waste in manufacturing and were beaten by three other industries in terms of waste generation.
In the food processing industries, we have seen an opposite trend. In 2005, these industries generated 743 000 tonnes of waste, which equals a 32 per cent increase since 1996. In comparison, the production rose by only 1 per cent in the same period. The food processing industries now have the highest level of waste generation among the manufacturing industries. Around 80 per cent of the waste was wetorganic waste and organic sludge.
The metal industries accounted for 23 per cent of the manufacturing waste. From 1996 to 2005 there was an increase in waste generation by nearly 180 000 tonnes, or around 40 per cent. The production of metal almost equalled the increase in waste generation, and hence the amount of waste generated per amount of produced metal was nearly unchanged.
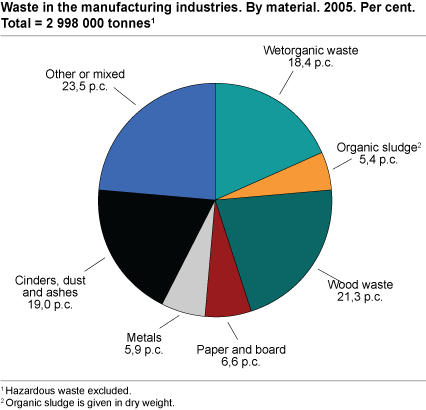
The materials in the waste from manufacturing are strongly related to the industry that generates the waste. The amount of wood waste decreased by 240 000 tonnes, or 27 per cent, from 1993 to 2005 due to lower waste amounts from the wood industries. Wood is still the most abundant material in the manufacturing waste, accounting for 21 per cent of the total. Cinders/dust/ashes and wetorganic waste comprise 19 and 18 per cent of the total respectively.
Manufacturing industries have positive effect on recovery rate
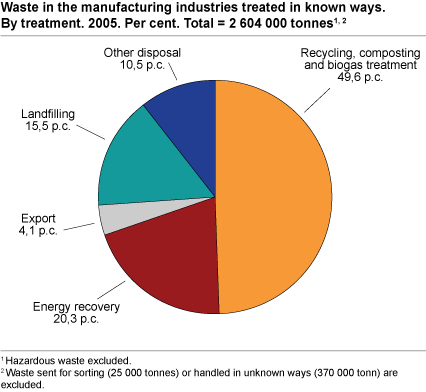
According to Statistics Norway’s calculations, about 74 per cent of the ordinary waste from the manufacturing industries was recovered in 2005. This is somewhat higher than the overall recovery rate of 69 per cent in Norway in the same year. Waste handled in unknown ways (370 000 tonnes) and waste sent for sorting (25 000 tonnes) was excluded. The recovery rate is close to the national target for 2010, set by the Norwegian government. The recovery figures contain uncertainty, see separate box below.
Some types of waste are easier to make use of than others, and this is reflected by the differences in recovery rate between the different material types. Seven material types had recovery rates exceeding 95 per cent: wet organic waste, paper/pulp/cardboard, organic sludge, electrical/electronic waste, metals, textiles and wood. At the same time, four material types had a recovery rate less than 30 per cent: cinders/dust/ashes, mixed waste, other mineral waste (gypsum, mineral wool, etc.) and inorganic sludge. These four waste types were mainly sent to landfills or other kind of disposal.
Recovery includes recycling, energy recovery, composting and biogas production. In addition, export is included in recovery, as practically all ordinary waste being exported is recovered.
The figures for 2004 and 2005 are based on a simplified data basis, and the figures for 2003 and 2004 have been revised since the previous release. For more information, see text boxes below.
The calculations for 2004 and 2005 build on simplified surveysThe statistics for 2004 and 2005 are based on the reporting of total waste amounts from a selection of establishments. The figures are allocated to material and treatment method based on the more comprehensive manufacturing waste survey for 2003. The distribution by material and treatment method relies on the assumption that the waste in each industry is distributed by material and treatment method in the same proportions in 2004 and 2005 as in 2003. The uncertainty in the figures distributed by material and treatment method is low for 2003, but increases with time from the basis year. The distribution by treatment method has a higher uncertainty than the distribution by material method. |
Revision of the reference years 2003 to 2005The figures on waste from manufacturing in 2003, 2004 and 2005 have been revised since the previous release. All manufacturing waste surveys are sample surveys, which means that occasionally important establishments are not included in the survey. In this revision we have replaced missing reporting in one reference year with reporting from the same establishment in one of the two other reference years. We have also adjusted for changes in number of employees. The waste amount has been recalculated based on the revised data. Due to this revision, the total waste amount in 2003 was adjusted upwards by about 500 000 tonnes, while the waste amount for 2004 was almost unchanged. The trend in waste from manufacturing now seems to be a slight decrease from 2003 to 2005. The figures for 1993, 1996 and 1999 were not included in this revision, and should therefore be regarded as more uncertain. |
Tables:
- Table 1 Waste in the manufacturing industries, by industry (1993, 1996, 1999, 2003 - 2005). 1 000 tonnes. Change in waste amount and production income, in total (1993 to 2005) and by industry (1996 to 2005). Per cent.
- Table 2 Waste in the manufacturing industries. By material. 1993, 1996, 1999, 2003 - 2005. 1 000 tonnes
- Table 3 Waste in the manufacturing industries. By treatment. 1993, 1996, 1999, 2003 - 2005. 1 000 tonnes
Contact
-
Manju Chaudhary
E-mail: manju.chaudhary@ssb.no
tel.: (+47) 99 58 02 06
-
Mona E. Onstad
E-mail: mona.onstad@ssb.no
tel.: (+47) 48 59 61 86
-
Camilla Skjerpen
E-mail: camilla.skjerpen@ssb.no
tel.: (+47) 48 22 72 14


