Content
Published:
This is an archived release.
Cinders, dust and ashes dominated in 2004
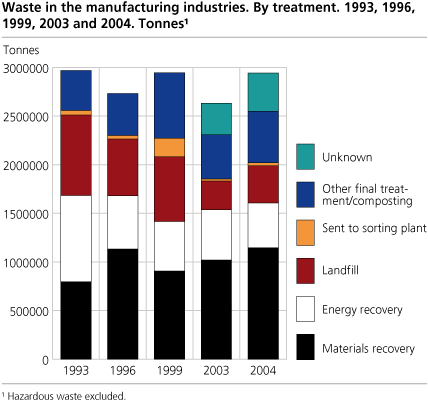
Waste amounts in the manufacturing industries stay on a steady level. In 2004, the manufacturers generated around 2.9 million tonnes of waste. Material recovery and incineration with energy recovery together made up 55 per cent of the total waste generated.
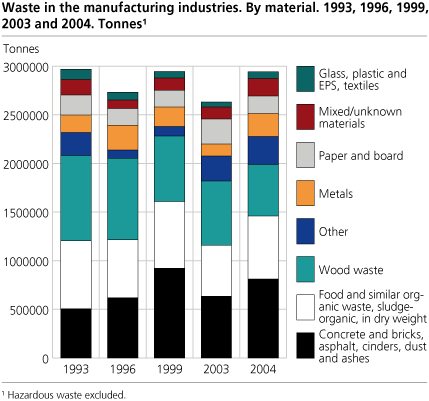
Around 660 000 tonnes, or 23 per cent, of the waste was cinders, dust and ashes. This is roughly 100 000 tonnes less than in 1999, and about 100 000 tonnes more than in 2003.
The largest industries
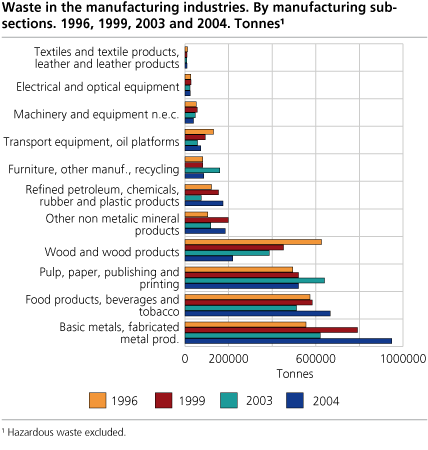
With its 771 000 tonnes, “Basic metals” contribute the most to the total for 2004, but they are closely followed by “Food products and beverages” with 665 000 tonnes and “Pulp, paper and paper products” with 412 000 tonnes.
The rather obvious increases in waste amounts from 2003 to 2004, for industries like “Basic metals”, “Fabricated metal products” and “Chemicals and chemical products”, can be related to the growth in export of goods in 2004 (see: http://www.ssb.no/english/subjects/09/05/muh_en/arkiv/ ).
Increase for some materials
In addition to “Cinders, dust and ashes”, we would like to point at other dominating materials like “Wood waste” (530 000 tonnes), “Food and similar organic waste” (458 000 tonnes) and “Metals” with 237 000 tonnes.
Among the major materials, we find the largest percentages of increase from 2003 to 2004 in “Metals” (+ 90 per cent), “Concrete and bricks” (+ 54 per cent) and “Food and similar organic waste” with + 30 per cent.
At the opposite end of the scale we find “Paper and board” with a 29 per cent drop from 2003 to 2004, along with “Wood waste” (20 per cent down).
Recovery still above 50 per cent
In 2004, material recovery and incineration with energy recovery together made up 55 per cent of total amounts generated in the manufacturing industries. This is a drop of 4 percentage points compared with 2003, but on the other hand, 6 percentage points more than in 1999.
Final disposal in landfills was 382 000 tonnes. Compared with 1993, 1996 and 1999, this is a major decline. However, in 2003 landfill was 88 000 tonnes less.
|
On the calculations
The statistics is compiled on the basis of sample surveys of the manufacturing industries, where around 1 800 out of roughly 20 000 establishments have been in the samples. Statistical errors may occur when inflating the samples. We will consider updating the figures given here, after more data have been added to the time series. |
Hazardous waste is excluded in this statistics. See http://www.ssb.no/english/subjects/01/05/30/spesavf_en/ for information.
For more figures, please visit StatBank Norway
Please read our articles on: Waste accounts for Norway :
Tables:
- Table 1 Waste in the manufacturing industries. By industry. 1993, 1996, 1999, 2003 and 2004. Tonnes
- Table 2 Waste in the manufacturing industries. By material. 1993, 1996, 1999, 2003 and 2004. Tonnes
- Table 3 Waste in the manufacturing industries. By treatment. 1993, 1996, 1999, 2003 and 2004. Tonnes
Contact
-
Manju Chaudhary
E-mail: manju.chaudhary@ssb.no
tel.: (+47) 99 58 02 06
-
Mona E. Onstad
E-mail: mona.onstad@ssb.no
tel.: (+47) 48 59 61 86
-
Camilla Skjerpen
E-mail: camilla.skjerpen@ssb.no
tel.: (+47) 48 22 72 14


