Content
Published:
This is an archived release.
More waste from manufacturing
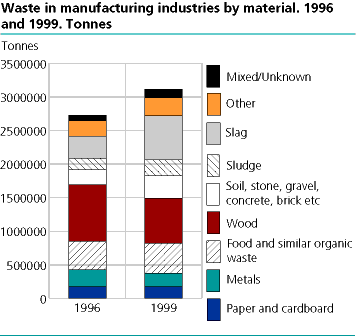
In 1999 manufacturing industries in Norway generated 3.5 million tonnes of waste, 430 000 tonnes of which was hazardous waste. That is an increase in total waste of 400 000 tonnes since 1996, according to revised figures. Wood and slag are the types of waste that are generated in greatest volumes, and we find the largest amount of waste in the basic metals industry.
Manufacturing and consumer waste totalled 3.1 million tonnes, as opposed to 2.7 and 3.0 million tonnes in 1996 and 1993, respectively. Henceforth manufacturing and consumer waste will be referred to simply as waste. Hazardous waste is described in a separate report.
Increase in waste volume
The growing waste volume is attributable in part to increased manufacturing at a number of enterprises, and in part to the fact that many companies report large amounts of natural, clean fill and concrete, brick and other mineral waste, which indicates a certain amount of building and demolition activity. Such waste volumes may vary greatly from year to year. Companies report having a better overview of waste now than three years ago. Because of this, and the fact that waste accounting methods have changed somewhat, one should be cautious about drawing too strong a conclusion as to the amount of change from 1996. Compared to the increase in volume index for manufacturing, which was 6.9 per cent between 1996 and 1999, the increase in waste volume was somewhat higher.
|
Total waste in manufacturing industries. 1993, 1996
and 1999. Tonnes |
| 1993 | 1996 | 1999 | |||||||||||||||||||||||||||||||||||||
|---|---|---|---|---|---|---|---|---|---|---|---|---|---|---|---|---|---|---|---|---|---|---|---|---|---|---|---|---|---|---|---|---|---|---|---|---|---|---|---|
| Total | 3 287 716 | 2 731 195 | 3 547 065 | ||||||||||||||||||||||||||||||||||||
| Production and consumer waste | 2 967 435 | 2 731 195 | 3 114 646 | ||||||||||||||||||||||||||||||||||||
| Hazardous waste | 320 282 | 400 933 | 432 419 | ||||||||||||||||||||||||||||||||||||
Less waste from the wood and wood products industry
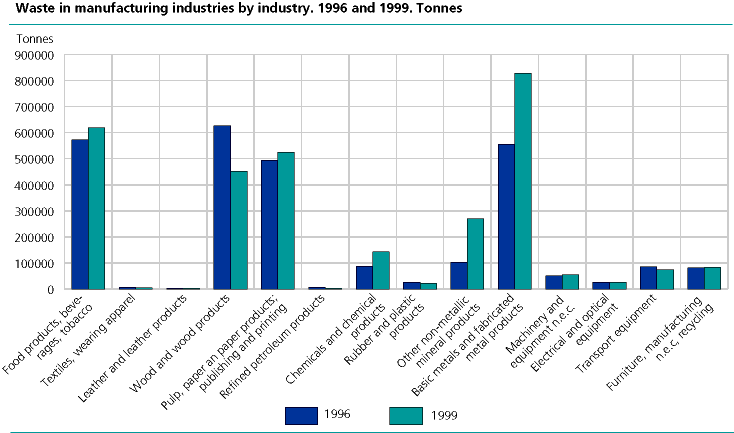
Waste from the wood and wood products industry has declined by 28 per cent. In many companies the reduction is due to lower production or production readjustments. Some of the waste reduction is also due to the fact that companies have reconsidered what should be regarded as waste. For example, the volumes of bark waste in the wood and wood products industry have dropped sharply from 1996 to 1999, and this cannot be explained by reduced production alone. The figures indicate that the bark is regarded instead as a product that replaces the fuel they otherwise would have to buy. This also has the effect that waste combusted through energy recycling becomes less.
The waste volumes for the chemical and chemical products industry, other non-metallic mineral products industry and basic metals industry are considerably greater for 1999 than for 1996. Some of the explanation is to be found in increased waste volumes resulting from growing production, but in some cases it is also explained by accidents in the company during the year. Improved drawing methods for the selection in 1999 is also part of the explanation. Consequently, it is difficult to state the exact size of the increase in waste generation in manufacturing enterprises.
Most waste from basic metals industry
The manufacturing industries that generated a lot of waste in 1996 did so in 1999 as well. The greatest waste generators were the basic metals industry, food products industry, wood and wood products industry, pulp, paper and paper products industry, non-metallic mineral products industry and chemical and chemical products industry - both years. However, while the wood and wood products industry was the greatest waste generator in 1996, the basic metals industry took over that ranking with about 800 000 tonnes in 1999, followed by the food products, beverages and tobacco industry, with approx. 620 00 tonnes.
Has manufacturing become more eco-conscious in its waste handling activities?
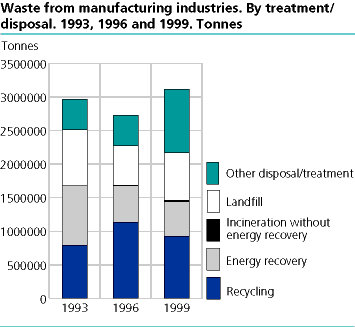
Material recycling, reuse, composting and incineration for energy recycling are considered to be more eco-friendly ways of handling waste than incineration without energy recycling or land filling. The two last-mentioned treatment methods go by the common designation final treatment. Approx. 737 000 tonnes of waste from manufacturing went to final treatment in 1999, as opposed to 590 000 tonnes in 1996. Those figures represent 22 and 24 per cent of the waste volumes, respectively, which is lower than the average for all waste in Norway, where the portion of waste going to final treatment use was slightly more than 40 per cent in recent years. This shows that manufacturing is on its way toward accomplishing its share of the target results for Norways national waste policy, which states that the amount of waste going to final treatment use by 2010 shall be about 25 per cent of the generated waste volume. More waste was deposited at the companies own landfill in 1999 than in 1996, while the amount deposited at external landfills is declining. The increase is primarily due to the fact that more waste was generated in 1999 than in 1996. Slag and sludge are the main waste materials deposited at the companies own landfill.
Not all types of materials cause serious environmental problems at external landfills. The organic fractions are assumed to cause the greatest damage, i.e. paper, wood, food, slaughter and fish waste, park and garden waste and certain types of sludge. In 1996 approx. 220 000 tonnes of these fractions were deposited at external landfills, or slightly more than 13 per cent. The corresponding figure for 1999 was 180 000 tonnes, a little below 12 per cent. As for recycling activities, i.e. material recycling, energy recycling, composting or sorting, the volumes have increased slightly since 1996. The figures show that there has been no radical change in practice, but the changes that have been made, have gone in the direction that environmental authorities want.
More composting
There is a major increase in the volume of waste that is composted, wood being the fastest increasing component therein. As for waste used as fill, most of the seemingly great increase of 59 per cent is probably explained by the fact that slag and natural, clean fill were not sufficiently included in the last survey. These are the types of waste that are mainly used as fill, often as the top layer in landfills.
Food and metal are recycled
The materials group where the greatest percentage of the waste was recycled in 1999 was food, slaughter and fish waste, with a recycling percentage of 85. Iron and basic metals are also high on the list, with a 70 per cent recycling share. Iron and basic metals sent to sorting had a recycling percentage of 92.
A certain portion of all types of materials ends up in landfills, but only for three fractions asphalt, ash and dust did that portion exceed 60 per cent.
Revised figures for 1996
The revision of data for 1999 has resulted in a re-evaluation and back calculation of the statistics from 1996. This concerns mostly waste treated by the companies in-house, either by incineration with energy recycling or by use as fill. The data revision has resulted in higher waste volumes for certain types of materials for 1996, mostly slag, sludge, wood and waste from food, slaughter and fish.
Contact
-
Manju Chaudhary
E-mail: manju.chaudhary@ssb.no
tel.: (+47) 99 58 02 06
-
Mona E. Onstad
E-mail: mona.onstad@ssb.no
tel.: (+47) 48 59 61 86
-
Camilla Skjerpen
E-mail: camilla.skjerpen@ssb.no
tel.: (+47) 48 22 72 14


