Content
Published:
This is an archived release.
Increased activity in mainland Norway
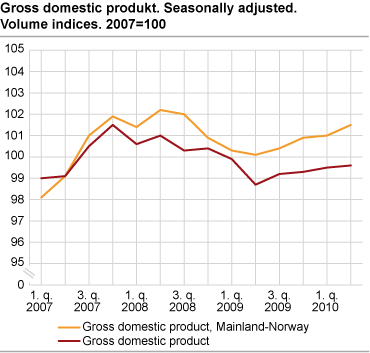
Gross domestic product (GDP) mainland Norway increased by 0.5 per cent in the 2nd quarter, displaying positive growth rates for four consecutive quarters. Both manufacturing and service-producing industries showed a marked increase in activity.
Total GDP seasonally adjusted increased by 0.1 per cent from the previous quarter. Domestic demand increased due to a rise in final consumption expenditure of general government and increased gross fixed capital formation. The export of traditional goods rose after two quarters of close to zero growth rates, while the decrease in household expenditure served to dampen the increase in economic activity.
Manufacturing expands
Value added in manufacturing rose by 0.6 per cent from the previous quarter. Chemical and mineral-producing industries in addition to wood and wood products industries were the strongest contributors to the expansion. The slowdown in the manufacturing industries came to a halt in the 2nd quarter of 2009, but growth rates for the first half of 2010 are only slightly higher than the last half of 2009.
Electricity and gas supply in isolation contributed negatively to the growth in GDP mainland Norway as well as affecting the activity in production of other goods. Conversely, construction showed a significant increase in production and cushioned the fall in production of other goods.
Service-producing industries rose in the 2nd quarter. Among industries boosting positive growth rates were business services and financial intermediation, while air transport and wholesale and retail trade contributed negatively. Air transport was markedly affected by the flight ban due to volcanic ash, which slowed down aviation activity in the whole of Europe.
General government rose by 0.3 per cent and was once again a contributor to the positive growth in GDP. Local government increased by 0.4 per cent from the previous quarter in spite of labour union strikes.
Seasonally-adjusted figures for the 1st and 2nd quarters are somewhat more uncertain due to the difficulty in adjusting for the effects of wholesale and retail trade during Easter. |
| 2008 | 2009 | 1st quarter 2009 | 2nd quarter 2009 | 3rd quarter 2009 | 4th quarter 2009 | 1st quarter 2010 | 2st quarter 2010 | ||||||||||||||||||||||||||||||||||||||||||||||||||||||||||||||||||||||||
|---|---|---|---|---|---|---|---|---|---|---|---|---|---|---|---|---|---|---|---|---|---|---|---|---|---|---|---|---|---|---|---|---|---|---|---|---|---|---|---|---|---|---|---|---|---|---|---|---|---|---|---|---|---|---|---|---|---|---|---|---|---|---|---|---|---|---|---|---|---|---|---|---|---|---|---|---|---|---|---|
| Gross domestic product (GDP) | 0.8 | -1.4 | -0.5 | -1.1 | 0.4 | 0.1 | 0.2 | 0.1 | |||||||||||||||||||||||||||||||||||||||||||||||||||||||||||||||||||||||
| GDP Mainland-Norway | 1.8 | -1.4 | -0.5 | -0.3 | 0.4 | 0.5 | 0.2 | 0.5 | |||||||||||||||||||||||||||||||||||||||||||||||||||||||||||||||||||||||
| Petroleum activities and ocean transport | -2.6 | -1.7 | -0.5 | -4.0 | 0.8 | -1.0 | 0.4 | -1.2 | |||||||||||||||||||||||||||||||||||||||||||||||||||||||||||||||||||||||
| Final domestic use of goods and services | 1.9 | -3.7 | -4.2 | 0.7 | -0.4 | 0.5 | 0.5 | 3.3 | |||||||||||||||||||||||||||||||||||||||||||||||||||||||||||||||||||||||
| Final consumption exp. of households | 1.5 | 0.0 | -0.7 | 1.9 | 1.1 | 1.2 | 0.5 | -0.6 | |||||||||||||||||||||||||||||||||||||||||||||||||||||||||||||||||||||||
| Final consumption exp. of general government | 4.1 | 4.7 | 2.9 | 0.9 | 1.1 | -0.6 | 1.4 | 1.2 | |||||||||||||||||||||||||||||||||||||||||||||||||||||||||||||||||||||||
| Gross fixed capital formation | 2.0 | -9.1 | -8.9 | -1.4 | -4.6 | 3.2 | -10.4 | 7.3 | |||||||||||||||||||||||||||||||||||||||||||||||||||||||||||||||||||||||
| Exports | 1.0 | -4.0 | -3.1 | -2.6 | 3.2 | 0.8 | -0.3 | -2.4 | |||||||||||||||||||||||||||||||||||||||||||||||||||||||||||||||||||||||
| Imports | 4.3 | -11.4 | -14.1 | 2.0 | 2.0 | 2.2 | 0.2 | 5.5 | |||||||||||||||||||||||||||||||||||||||||||||||||||||||||||||||||||||||
| Total employed | 3.2 | -0.4 | -0.4 | -0.4 | -0.3 | 0.0 | -0.1 | -0.1 | |||||||||||||||||||||||||||||||||||||||||||||||||||||||||||||||||||||||
| Total man-hours worked | 3.5 | -1.8 | -0.7 | -0.3 | -0.3 | -0.2 | -0.2 | -0.1 | |||||||||||||||||||||||||||||||||||||||||||||||||||||||||||||||||||||||
Decreased consumption expenditure
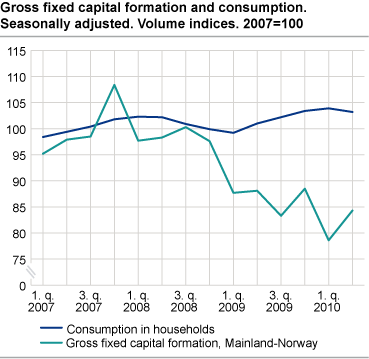
Household final consumption expenditure fell by 0.6 per cent in the 2nd quarter, mostly due to a fall in the consumption of goods. Close to half of the reduction in the consumption of goods is due to a drop in the consumption of electricity. The consumption of services increased somewhat, while direct purchases abroad by resident households fell steeply and contributed in isolation to a fall of 0.3 percentage points of total household expenditure. The reduction of consumption abroad is linked to the reduced aviation activity following the volcano eruption in Iceland.
Gross fixed capital formation strengthens
Quarterly national accounts figures show an increase in both oil and mainland investments. The growth in gross fixed capital formation in mainland Norway is mostly due to an increase in gross fixed capital formation in general government. Manufacturing on the other hand contributed negatively.
The drop in household investments in dwellings, which started at the end of 2007, has now stopped and showed an increase of 0.1 per cent in the 2nd quarter of 2010.
Although gross fixed capital formation rose in the 2nd quarter, the combined growth in the first half of 2010 is 5.6 per cent lower than the first half of 2009. Two thirds of this drop is due to comparably lower figures for gross fixed capital formation in general government.
Reduced exports and increased imports
While total exports fell, the export of traditional goods increased by 0.8 per cent. Imports of traditional goods rose by 4.6 per cent and thus contributed the most to the total increase in imports. Other imports that rose noticeably were metals and machinery and other equipment.
Slight reduction in employment
Seasonally-adjusted figures show a reduction of 0.1 per cent in employed persons in the 2nd quarter. The slowdown began in the 2nd half of 2008 and has been less pronounced in the last three quarters. Employment in manufacturing fell by 0.9 per cent and in wholesale and retail trade by 1.4 per cent, while increased employment figures for local government contributed positively.
Total hours worked fell by 0.1 per cent. Strikes in construction and local government contributed negatively, whereas a reduction in sick leave served to lessen the decline in hours worked.
Revisions of 2008 and 2009
Figures for 2008 are revised due to the incorporation of new structural business statistics. As a result, GDP for 2008 is revised downwards by 1.0 percentage points and GDP mainland Norway by 0.4 percentage points. Among the main contributors to the downward adjustments are oil and gas extraction industry and business services. Household consumption expenditure is revised upwards from 1.2 per cent to 1.5 per cent in 2008.
For 2009 the growth rate in GDP and GDP mainland Norway is revised upwards with 0.2 percentage points, primarily due to a revision of the construction industry.
The q/q growth in GDP mainland Norway for the 1st quarter of 2010 is revised upwards by 0.1 percentage points.
| 2008 | 2009 | 4th quarter 2009 | 1st quarter 2010 | ||||||||||||||||||||||||||||||||||||||||||||||||||||||||||||||||||||||||||||
|---|---|---|---|---|---|---|---|---|---|---|---|---|---|---|---|---|---|---|---|---|---|---|---|---|---|---|---|---|---|---|---|---|---|---|---|---|---|---|---|---|---|---|---|---|---|---|---|---|---|---|---|---|---|---|---|---|---|---|---|---|---|---|---|---|---|---|---|---|---|---|---|---|---|---|---|---|---|---|---|
| New result | Former result | New result | Former result | Seasonally adjusted figures | Unadjusted figures | Seasonally adjusted figures | Unadjusted figures | ||||||||||||||||||||||||||||||||||||||||||||||||||||||||||||||||||||||||
| Percentage change in volume from the previous period | Percentage change in volume from the same period in the previous year | Percentage change in volume from the previous period | Percentage change in volume from the same period in the previous year | ||||||||||||||||||||||||||||||||||||||||||||||||||||||||||||||||||||||||||||
| New result | Former result | New result | Former result | New result | Former result | New result | Former result | ||||||||||||||||||||||||||||||||||||||||||||||||||||||||||||||||||||||||
| Gross domestic product (GDP) | 0.8 | 1.8 | -1.4 | -1.6 | 0.1 | 0.1 | -1.1 | -1.2 | 0.2 | -0.1 | -0.8 | -0.9 | |||||||||||||||||||||||||||||||||||||||||||||||||||||||||||||||||||
| GDP Mainland Norway | 1.8 | 2.2 | -1.4 | -1.6 | 0.5 | 0.4 | 0.1 | 0.0 | 0.2 | 0.1 | 0.5 | 0.8 | |||||||||||||||||||||||||||||||||||||||||||||||||||||||||||||||||||
| Household final consumtion expenditure | 1.5 | 1.2 | 0.0 | 0.0 | 1.2 | 1.3 | 3.4 | 3.4 | 0.5 | 0.7 | 5.9 | 5.7 | |||||||||||||||||||||||||||||||||||||||||||||||||||||||||||||||||||
| Final consumption of general government | 4.1 | 4.1 | 4.7 | 4.8 | -0.6 | -0.7 | 5.2 | 4.9 | 1.4 | 1.0 | 2.3 | 3.4 | |||||||||||||||||||||||||||||||||||||||||||||||||||||||||||||||||||
| Gross fixed capital formation | 2.0 | 1.4 | -9.1 | -7.9 | 3.2 | 3.0 | -11.2 | -7.7 | -10.4 | -11.0 | -13.9 | -13.6 | |||||||||||||||||||||||||||||||||||||||||||||||||||||||||||||||||||
| Exports | 1.0 | 0.9 | -4.0 | -4.0 | 0.8 | 1.0 | -1.4 | -1.3 | -0.3 | -0.2 | 0.8 | 0.0 | |||||||||||||||||||||||||||||||||||||||||||||||||||||||||||||||||||
| Imports | 4.3 | 2.2 | -11.4 | -10.3 | 2.2 | 0.6 | -9.0 | -5.2 | 0.2 | -0.5 | 6.5 | 2.4 | |||||||||||||||||||||||||||||||||||||||||||||||||||||||||||||||||||
| Percentage change in volume from the previous quarter | |||||||||||||||||||||||||||||||||||||||||||||||||||||||||||||||||||||||||||||||
|---|---|---|---|---|---|---|---|---|---|---|---|---|---|---|---|---|---|---|---|---|---|---|---|---|---|---|---|---|---|---|---|---|---|---|---|---|---|---|---|---|---|---|---|---|---|---|---|---|---|---|---|---|---|---|---|---|---|---|---|---|---|---|---|---|---|---|---|---|---|---|---|---|---|---|---|---|---|---|---|
| 2008 | 2009 | 2010 | |||||||||||||||||||||||||||||||||||||||||||||||||||||||||||||||||||||||||||||
| 1st quarter | 2nd quarter | 3rd quarter | 4th quarter | 1st quarter | 2nd quarter | 3rd quarter | 4th quarter | 1st quarter | 2nd quarter | ||||||||||||||||||||||||||||||||||||||||||||||||||||||||||||||||||||||
| Sweden | -1.1 | 0.0 | 0.1 | -4.0 | -2.9 | 0.6 | 0.4 | 0.5 | 1.5 | 1.2 | |||||||||||||||||||||||||||||||||||||||||||||||||||||||||||||||||||||
| Denmark | -1.4 | 1.2 | -1.0 | -2.3 | -1.8 | -1.8 | 0.6 | 0.2 | 0.5 | .. | |||||||||||||||||||||||||||||||||||||||||||||||||||||||||||||||||||||
| Finland | 0.3 | 0.4 | -0.7 | -3.1 | -5.6 | -0.3 | 0.6 | -0.2 | -0.4 | .. | |||||||||||||||||||||||||||||||||||||||||||||||||||||||||||||||||||||
| Germany | 1.4 | -0.7 | -0.4 | -2.2 | -3.4 | 0.5 | 0.7 | 0.3 | 0.5 | 2.2 | |||||||||||||||||||||||||||||||||||||||||||||||||||||||||||||||||||||
| France | 0.5 | -0.7 | -0.2 | -1.6 | -1.5 | 0.1 | 0.3 | 0.6 | 0.2 | 0.6 | |||||||||||||||||||||||||||||||||||||||||||||||||||||||||||||||||||||
| UK | 0.5 | -0.3 | -0.9 | -2.1 | -2.3 | -0.7 | -0.3 | 0.4 | 0.3 | 1.1 | |||||||||||||||||||||||||||||||||||||||||||||||||||||||||||||||||||||
| USA | -0.2 | 0.1 | -1.0 | -1.7 | -1.2 | -0.2 | 0.4 | 1.2 | 0.9 | 0.6 | |||||||||||||||||||||||||||||||||||||||||||||||||||||||||||||||||||||
| Norway | -0.9 | 0.3 | -0.7 | 0.2 | -0.5 | -1.1 | 0.4 | 0.1 | 0.2 | 0.1 | |||||||||||||||||||||||||||||||||||||||||||||||||||||||||||||||||||||
Tables
Contact
-
Pål Sletten
E-mail: pal.sletten@ssb.no
tel.: (+47) 99 29 06 84
-
Ingunn Sagelvmo
E-mail: ingunn.sagelvmo@ssb.no
tel.: (+47) 40 90 26 32
-
Pia Tønjum
E-mail: pia.tonjum@ssb.no
tel.: (+47) 48 99 12 07
-
Kristian Gimming
E-mail: kristian.gimming@ssb.no
tel.: (+47) 91 88 39 06


