Content
Published:
This is an archived release.
Continued strong growth in mainland economy
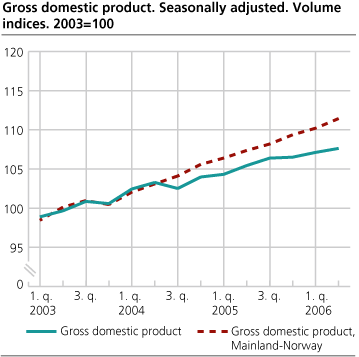
According to preliminary seasonally adjusted figures Gross Domestic Product (GDP) for mainland Norway had strong growth in the second quarter of 2006. The growth in GDP was mainly driven by high production of wholesale and business services.
GDP for mainland Norway rose by 1.1 per cent in the second quarter.
Following strong growth for several periods gross value added for manufacturing increased by 0.2 per cent in the second quarter of 2006. Building of ships and manufacturing of machinery and other equipment increased while manufacturing of wood and wood products, pulp and paper products together with basic metals decreased.
| Gross domestic product 2. quarter 2005 to 2. quarter 2006. Percentage change in volume from the previous period (seasonally adjusted) |
| 2004 | 2005 | 2. quarter 2005 | 3. quarter 2005 | 4. quarter 2005 | 1. quarter 2006 | 2. quarter 2006 | |||||||||||||||||||||||||||||||||
|---|---|---|---|---|---|---|---|---|---|---|---|---|---|---|---|---|---|---|---|---|---|---|---|---|---|---|---|---|---|---|---|---|---|---|---|---|---|---|---|
| Gross domestic product (GDP) | 3.1 | 2.3 | 1.1 | 0.9 | 0.1 | 0.6 | 0.5 | ||||||||||||||||||||||||||||||||
| Mainland-Norway | 3.8 | 3.7 | 0.9 | 0.8 | 1.1 | 0.8 | 1.1 | ||||||||||||||||||||||||||||||||
| Petroleum activities and ocean transport | 0.4 | -3.4 | 1.8 | 1.5 | -4.1 | -0.3 | -2.5 | ||||||||||||||||||||||||||||||||
| Final domestic use of goods and services | 6.1 | 4.6 | 1.1 | 1.8 | 1.2 | 0.2 | 1.7 | ||||||||||||||||||||||||||||||||
| Final consumption exp. of households | 4.7 | 3.2 | 1.7 | 0.6 | 0.0 | 2.0 | 0.6 | ||||||||||||||||||||||||||||||||
| Final consumption exp. of general government | 2.2 | 1.5 | 0.3 | 0.0 | 0.7 | 0.3 | 0.7 | ||||||||||||||||||||||||||||||||
| Gross fixed capital formation | 8.1 | 10.9 | 3.3 | 1.9 | 11.0 | -8.4 | 5.4 | ||||||||||||||||||||||||||||||||
| Exports | 0.6 | 0.7 | 3.1 | 0.9 | -1.3 | 1.2 | -0.2 | ||||||||||||||||||||||||||||||||
| Imports | 8.9 | 7.4 | 4.1 | 3.6 | 1.5 | 0.4 | 3.4 | ||||||||||||||||||||||||||||||||
| Total employed | 0.4 | 0.7 | 0.1 | 0.6 | 0.5 | 0.8 | 0.6 | ||||||||||||||||||||||||||||||||
| Total man-hours worked | 1.9 | 0.8 | 0.2 | 0.2 | 0.4 | 0.5 | 0.6 | ||||||||||||||||||||||||||||||||
Total GDP for Norway increased by 0.5 per cent in the second quarter as value added for oil and gas extraction decreased for the third quarter in a row.
Continued growth in number of employed persons
The number of employed persons rose by 0.6 per cent in the second quarter. Higher employment in business services, wholesale and construction can primarily explain the growth. Total hours worked rose by 0.6 per cent.
Compared with employment figures a year ago the number of employed persons has increased by around 57 000 persons.
Growth in consumption
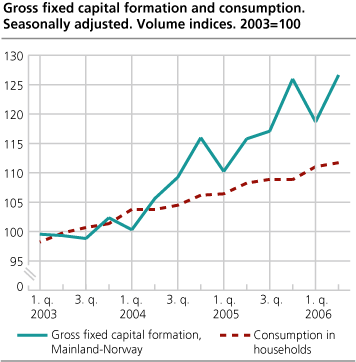
Household final consumption expenditure increased by 0.6 per cent. Consumption of services rose over 1 per cent in the second quarter. This was mainly due to higher demand for recreation and culture services and hotels and restaurants services. Consumption of goods increased by 0.6 per cent.
Final consumption expenditure in general government was 2 per cent higher the first half of 2006 than the first half of 2005. Increased health and social services were the main factor behind this development.
| Revised figures of final expenditure and gross domestic product. Percentage change in volume |
| 2005 | 1. quarter 2006 | ||||||||||||||||||||||||||||||||||||||
|---|---|---|---|---|---|---|---|---|---|---|---|---|---|---|---|---|---|---|---|---|---|---|---|---|---|---|---|---|---|---|---|---|---|---|---|---|---|---|---|
| New result | Former result | Seasonally adjusted figures | Unadjusted figures | ||||||||||||||||||||||||||||||||||||
| Percentage change in volume from the previous period | Percentage change in volume from the same period in the previous year | ||||||||||||||||||||||||||||||||||||||
| New result | Former result | New result | Former result | ||||||||||||||||||||||||||||||||||||
| Gross domestic product | 2.3 | 2.3 | 0.6 | 0.6 | 5.6 | 5.4 | |||||||||||||||||||||||||||||||||
| Mainland Norway | 3.7 | 3.7 | 0.8 | 0.6 | 7.3 | 7.1 | |||||||||||||||||||||||||||||||||
| Household final consumtion expenditure | 3.2 | 3.2 | 2.0 | 1.6 | 4.7 | 4.5 | |||||||||||||||||||||||||||||||||
| Final consumption of general government | 1.5 | 1.5 | 0.3 | 1.2 | 6.3 | 6.6 | |||||||||||||||||||||||||||||||||
| Gross fixed capital formation | 10.9 | 10.9 | -8.4 | -8.9 | 7.7 | 6.7 | |||||||||||||||||||||||||||||||||
| Exports | 0.7 | 0.7 | 1.2 | 1.1 | 5.8 | 5.6 | |||||||||||||||||||||||||||||||||
| Imports | 7.4 | 7.4 | 0.4 | 0.9 | 12.8 | 13.0 | |||||||||||||||||||||||||||||||||
Increased investments
Following a decrease in the first quarter, gross fixed capital formation increased more than 5 percent in the second quarter.
Investments in dwellings were nearly the same level as in the first quarter. From the first half of 2005 to the first half of 2006 investments in dwellings rose by more than 7 per cent.
Gross fixed capital formation in oil and gas extraction increased by almost 6 per cent in the second quarter after a decrease in the beginning of 2006.
Strong growth in exports of traditional goods
Following a decrease in the first quarter exports of traditional goods increased over 2 per cent. Higher export of machinery and other equipment, basic chemicals and basic metals explains this development.
Total exports were nearly unchanged from the first quarter.
Total imports continued to rise in the second quarter of 2006. Over 40 per cent of the increase in total imports can be attributed to higher imports of services. Imports of traditional goods increased by 1.7 per cent.
For more information about foreign trade, click here
| GDP figures. Seasonally adjusted |
| Percentage change in volume from the previous quarter | |||||||||||||||||||||||||||||||||||||||
|---|---|---|---|---|---|---|---|---|---|---|---|---|---|---|---|---|---|---|---|---|---|---|---|---|---|---|---|---|---|---|---|---|---|---|---|---|---|---|---|
| 2005 | 2006 | ||||||||||||||||||||||||||||||||||||||
| 1st quarter | 2nd quarter | 3rd quarter | 4th quarter | 1st quarter | 2nd quarter | ||||||||||||||||||||||||||||||||||
| Sweden | 0.3 | 0.8 | 1.2 | 1.0 | 1.4 | 1.4 | |||||||||||||||||||||||||||||||||
| Denmark | 0.9 | 1.5 | 0.7 | 0.2 | 0.4 | 1.9 | |||||||||||||||||||||||||||||||||
| Finland | 0.9 | 0.3 | 1.2 | 0.7 | 1.3 | - | |||||||||||||||||||||||||||||||||
| Germany | 0.6 | 0.3 | 0.5 | 0.3 | 0.7 | 0.9 | |||||||||||||||||||||||||||||||||
| France | 0.1 | 0.0 | 0.7 | 0.2 | 0.5 | 1.1 | |||||||||||||||||||||||||||||||||
| UK | 0.3 | 0.5 | 0.5 | 0.6 | 0.8 | 0.7 | |||||||||||||||||||||||||||||||||
| USA | 0.8 | 0.8 | 1.0 | 0.4 | 1.4 | 0.7 | |||||||||||||||||||||||||||||||||
Revised figures for 2006
The unadjusted GDP growth for mainland Norway and the growth in total GDP are revised up by 0.2 per cent in the first quarter of 2006. This is due new information about production of services. Growth in household final consumption expenditure is changed from 4.5 to 4.7 per cent in the first quarter. Of the other macroeconomic figures, only gross fixed capital formation has significant revisions.
Tables
Contact
-
Pål Sletten
E-mail: pal.sletten@ssb.no
tel.: (+47) 99 29 06 84
-
Ingunn Sagelvmo
E-mail: ingunn.sagelvmo@ssb.no
tel.: (+47) 40 90 26 32
-
Pia Tønjum
E-mail: pia.tonjum@ssb.no
tel.: (+47) 48 99 12 07
-
Kristian Gimming
E-mail: kristian.gimming@ssb.no
tel.: (+47) 91 88 39 06


