Content
Published:
This is an archived release.
Employment down and production up in 2000
Employment in industry fell by nearly 10 000 from 1999 to 2000, a decline of 3.3 per cent. The employment figures are lower than the preliminary figures for year 2000. The production increased by 5 per cent measured in current prices.
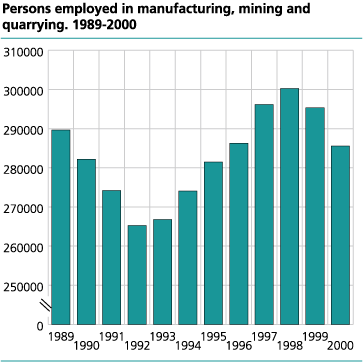
The drop in employment came among the largest companies. The largest companies showed an employment reduction of nearly 7 per cent. On the other hand, for companies with fewer than 50 employees there was an increase in employment.
Most industries experienced declining employment during 2000. The employment reduction was particularly high within platform building, where it fell by 3200 persons from 1999 to 2000.
Production increased slightly in 2000
The gross value of production went up by NOK 23.8 billion or 5.0 per cent from 1999 to 2000 and totalled NOK 497.1 billion. Much of the increase may be explained by the increase in prices of oil andraw materials. We can see this in the figures, as it is the figures for the basic metals and basic chemicals and refined petroleum products that have increased.

In platform building production value fell by as much as NOK 10 billion in 2000 compared with 1999. For ship building the decline has flattened out and the figures are on the same level as they were after the decline from 1998 to 1999. Product value also declined much within office machinery and computers and electrical machinery and apparatus. However, the increase in telecommunications is so high that the decline is levelled out for the electrical industry altogether.
Slightly increased value added
Value added measured in market prices increased by only 3.8 per cent in 2000, in spite of the fact that production increased by 5 per cent. This is partly due the increase in the costs measured by product input, i.e. without wage costs. Value added amounted to NOK 147.0 billion in 2000 for manufacturing, mining and quarrying, about 5 billion more than in 1999.

The total wage costs went up by only 2.7 per cent from 1999 to 2000, while the increase in wage cost per employee was 6.2 per cent. This can be explained by the weak employment trend.
Continued declining investments
Following a period from 1993 to 1998 with steady increase in investments, there has been a decline of NOK 4.7 billion to NOK 16.5 billion during the last two years. However, the decline was half the size of the decline in investments the year before, with a decline of NOK 1.6 billion. The investments were not quite as low as expected according to preliminary figures, and measured in current prices, the level is about the same as in 1995.
Tables:
- Table 1 Mining, quarrying and manufacturing. Principal figures for local kind of activity units. 1972-2000
- Table 2 Mining, quarrying and manufacturing. Principal figures for local kind of activity units, by industry division. 1996-2000
- Table 3 Mining, quarrying and manufacturing. Principal figures for local kind of activity units, by county. 1999-2000.
The statistics is now published as Business statistics.
Contact
-
Statistics Norway's Information Centre
E-mail: informasjon@ssb.no
tel.: (+47) 21 09 46 42