Content
Published:
This is an archived release.
New dwellings still up
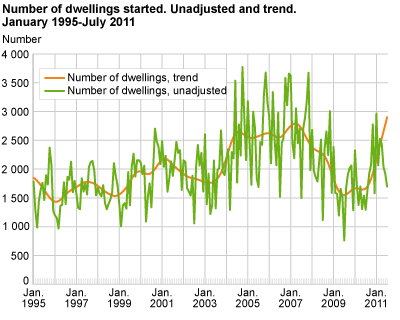
Preliminary figures show a marked increase in new dwellings in January-July 2011, compared with the same period last year. The number of new dwellings increased by almost 40 per cent.
A total of 15 640 new dwellings were given building starts in January-July; an increase of 4 354 dwellings compared with same period last year. In all, building starts were given for 5.2 million square metres of utility floor space; an increase of 5.6 per cent.
Smaller changes for other buildings
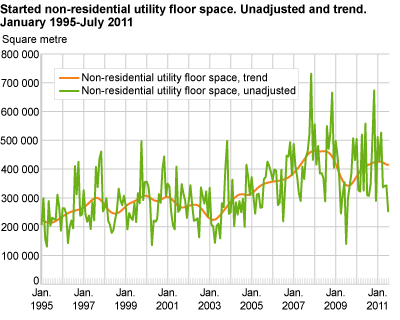
A total of 2.2 million square metres of utility floor space for industrial buildings were started hitherto. This is 12 per cent less compared with the same period in 2010.
Holiday properties (cottages), private garages and other non-industrial activities similarly increased by 0.6 per cent.
In all, building starts of utility floor space for other than dwellings decreased by 8.6 per cent.
| July |
Changes in
per cent |
January-July |
Changes in
per cent |
||||||||||||||||||||||||||||||||||||||||||||||||||||||||||||||||||||||||||||
|---|---|---|---|---|---|---|---|---|---|---|---|---|---|---|---|---|---|---|---|---|---|---|---|---|---|---|---|---|---|---|---|---|---|---|---|---|---|---|---|---|---|---|---|---|---|---|---|---|---|---|---|---|---|---|---|---|---|---|---|---|---|---|---|---|---|---|---|---|---|---|---|---|---|---|---|---|---|---|---|
| 20101 | 2011 | 20101 | 2011 | ||||||||||||||||||||||||||||||||||||||||||||||||||||||||||||||||||||||||||||
| Number of dwellings | 1 295 | 1 697 | 31.0 | 11 286 | 15 640 | 38.6 | |||||||||||||||||||||||||||||||||||||||||||||||||||||||||||||||||||||||||
| Utility floor space, 1 000 m2 | |||||||||||||||||||||||||||||||||||||||||||||||||||||||||||||||||||||||||||||||
| Total | 582.0 | 541.1 | -7.0 | 4 953.7 | 5 230.1 | 5.6 | |||||||||||||||||||||||||||||||||||||||||||||||||||||||||||||||||||||||||
| Dwellings | 206.7 | 246.2 | 19.1 | 1 629.4 | 2 190.6 | 34.4 | |||||||||||||||||||||||||||||||||||||||||||||||||||||||||||||||||||||||||
| Other buildings | 375.3 | 294.8 | -21.4 | 3 324.3 | 3 039.5 | -8.6 | |||||||||||||||||||||||||||||||||||||||||||||||||||||||||||||||||||||||||
| Industrial buildings2 | 253.1 | 194.4 | -23.2 | 2 488.6 | 2 198.4 | -11.7 | |||||||||||||||||||||||||||||||||||||||||||||||||||||||||||||||||||||||||
| Holiday property(cottages), private garages and other non-industrial activities | 122.2 | 100.4 | -17.8 | 835.7 | 841.2 | 0.6 | |||||||||||||||||||||||||||||||||||||||||||||||||||||||||||||||||||||||||
| 1 | The figures for all months from January 2008 until December 2010 where revised 11 March 2011. |
| 2 | Also Includes building for education, health and social work and public administration. |
More figures are available in Statbank .
Registered building permissionsFigures for buildings in the building statistics rely on dates for when permits are registered by the municipality in the data register (Matrikkelen). A building permit does not always mean that construction will be started at once. Especially in low conjunctures it might be that construction projects are not realised, or may be postponed after a building permit has been granted. When the building activity trend turns from a low to a high level, and vice versa, this could affect the interpretation of the statistics. More about comparability, quality and other information in "About the statistics" . |
Contact
-
Jens Mathiesen
E-mail: jens.mathiesen@ssb.no
tel.: (+47) 40 81 13 98
-
Magnus Espeland
E-mail: magnus.espeland@ssb.no
tel.: (+47) 45 27 40 08


