Content
Published:
This is an archived release.
New dwellings down 14 per cent
In January this year, building starts for 2 299 dwellings were registered. This is a decrease of 14.2 per cent compared with January 2008. The decrease also continues for buildings other than dwellings.
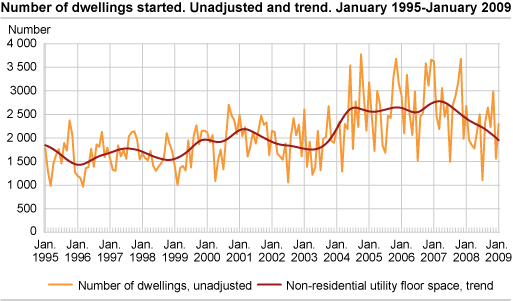
The number of building starts for dwellings is slightly lower than last year, down from 2 679 dwellings in January 2008 to 2 299 in January 2009.
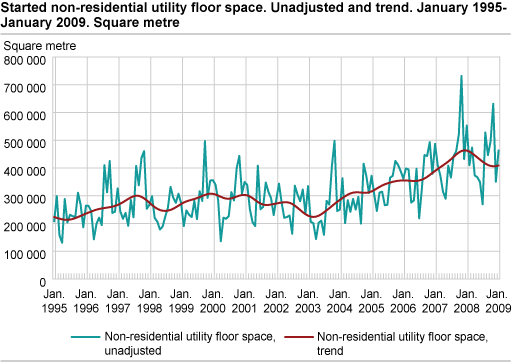
Building activity fell overall, measured in square metres of utility floor space, by 17.5 per cent, or 166 800 m2. Started utility floor space fell for dwellings, industrial buildings and holiday property etc. Started utility floor space for dwellings fell 13.7 per cent, from 346 600 m2 in January last year to 299 000 m2 in January 2009. Industrial buildings and holiday properties etc. fell similarly by 21.7 and 13.0 per cent, or 100 700 and 18 600 m2 respectively.
Increasing delay in the registration of building startsThe average monthly registration delay for buildings started increased in 2008. This means that a larger share of older building projects are registered as started in the Ground Parcel, Address and Building Register (GAB). The decreasing trend may therefore be greater than what is shown by the building statistics. In addition, projects that have been registered as started may have been postponed for an indefinite time due to fall in demand. Conversion to new property registerAs of 5 November 2008, the municipalities will be transferred in groups from the Ground Parcel, Address and Building Register (GAB) to the new property register, Matrikkelen. All municipalities will be transferred by the end of February 2009. In connection with the conversion there may be some delay in the registration of the municipalities that are being transferred. The Norwegian Mapping and Cadastre Authority has an overview of transfer dates for each municipality . |
Tables:
- Table 1 Building work started. Preliminary figures
- Table 2 Building activity in January. Preliminary figures
- Table 3 Building work started in January, by county. Preliminary figures
- Table 4 Buildings under conctruction per 31 January, by county. Preliminary figures
- Table 5 Buildings completed in January, by county. Preliminary figures
- Table 6 Building work started. Not adjusted, seasonally adjusted and trend. Preliminary figures
- Table 7 Buildings permits in January. Preliminary figures. Breakdown according to Eurostat classifications
- Table 8 Average monthly registration delay for buildings started. January 2006-January 2009
Contact
-
Jens Mathiesen
E-mail: jens.mathiesen@ssb.no
tel.: (+47) 40 81 13 98
-
Magnus Espeland
E-mail: magnus.espeland@ssb.no
tel.: (+47) 45 27 40 08