How to select variables and values in StatBank
Diverse hjelpesider
After selcting a table the next page is "Choose variable". This is where you select variables and values.
How do I select values?
You select one value by clicking the mouse.
You can select all values from a variable using the "Select all"-button and remove all selections by clicking "Deselect all"-button.

Several individual values
- Hold the Ctrl-key in while clicking on the required values. (Cmd-key on Mac)
- Keyboard/screenreader: Hold the Ctrl-key + arrow up/down. Release Ctrl and press space-key. Repeat for each value.
Several consecutive lines
- First, click on one value, then keep the Shift key pressed while clicking on another value.
- Or – click on a value and then left click on the mouse while moving the cursor up/down.
- Keyboard/screenreader: Hold the Shift-key + arrow up/down.
Search
You can search for variables, ether at the veginning of a word or as a string. Your hits will be selected and shown in the top of the listing.
Expert or list view
You can choose between "List view" and "Expert view". "Expert view" is a compact listing and is suitable on large screens (PC).

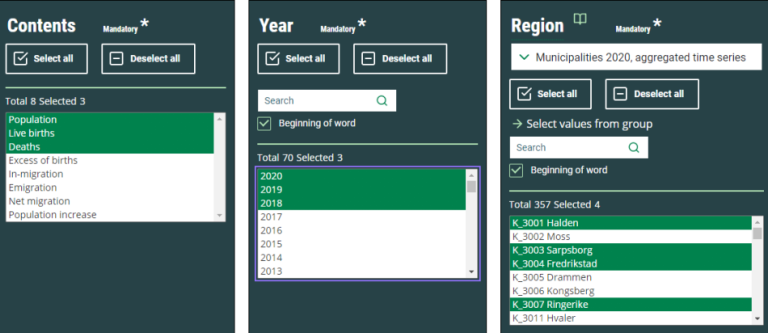
Table content
The first choice are the available contents. All tables in StatBank have at least one content variable. Click to highlight one or more values.
Classification variables
There are also one or more boxes, each representing a classification variable. The available values are listed in the boxes. If, for instance, you want the figure for a specific municipality, highlight this in the list box with the variable name “Region”.
Show table
When you have marked all the values that you want for your table, click "Show table". Here you also can see how many cells you have selected for your table. The limit is 300.000 cells.
How do I get the total figure for a variable?
For some variables, if you don’t select any values you will be given a total figure.
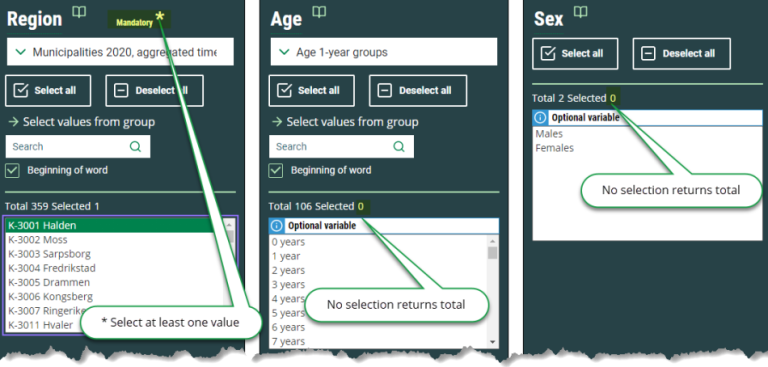
If you have selected one or more values and want to remove these in order to get a total figure, use "Deselect all".
If the variable is of a kind that selection is mandatory there will be a * after the name.
How do I change groupings of variables?
For some variables it is best to have different groupings of values, such as for the variable “Region”. The values here can be grouped as “Municipalities”, “Counties”, “Whole country” or others. These variables always have a pulldown menu from the list box.
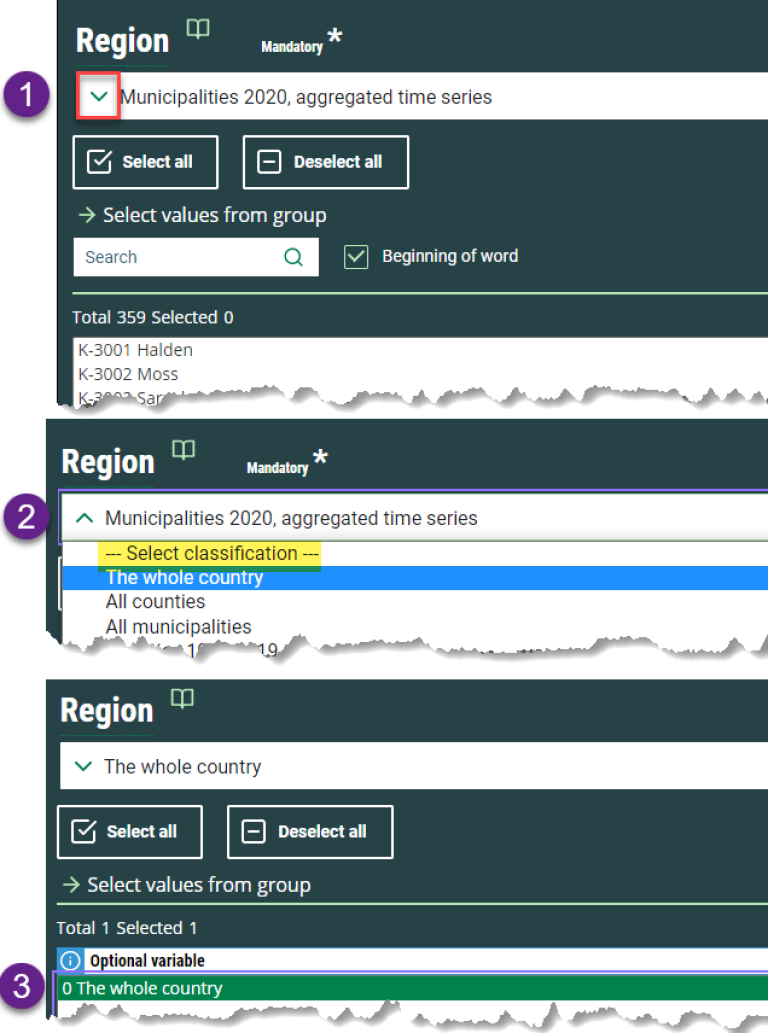
If you change this from, for instance, “Municipalities” to “Counties”, the content in the list box is replaced with values for the counties. You cannot select municipality and county in the same operation. If you require the figure for Norway as a whole, select “The whole country” from the pulldown menu. The values in the list box are then changed. Select “0…Whole country” in this list box.
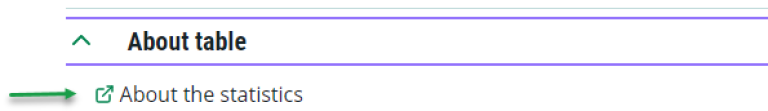
Where can I find more information on the statistics, definitions and standards?
If you expand "About table", you will find a link to "About the statstics". Her you get information about purpose, production, definitions and other metainformation.
You can notice that some variable headings have a book icon.

These are links to variable definitions (Vardok) or classification standards (Klass). The variable ”Region” contains, for example, Statistics Norway’s standard classifications for municipalities and counties, as well as ways of organising municipalities through what are known as correspondence tables.
How do I use “Select via groups”?

This function is used for variables that have groupings. You can either select individual values for the group’s content or totals of individual values.
How do I search for large valuesets?
In a few tables where a variable has got a more than 1000 values you should use Advanced search.
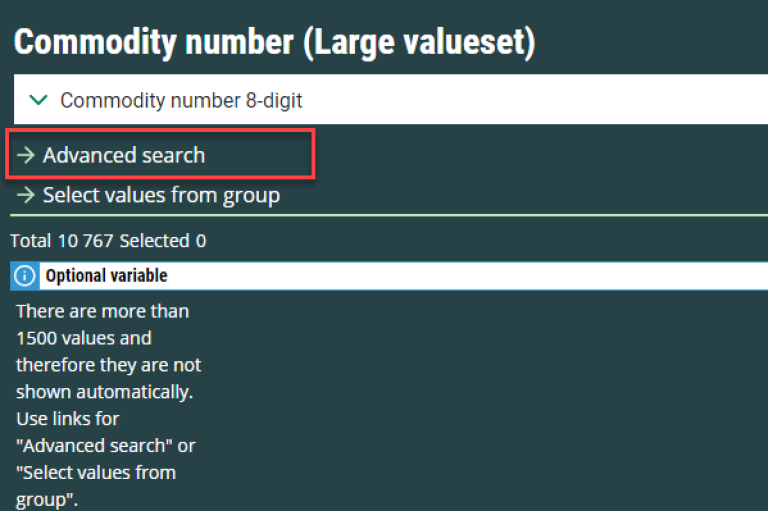
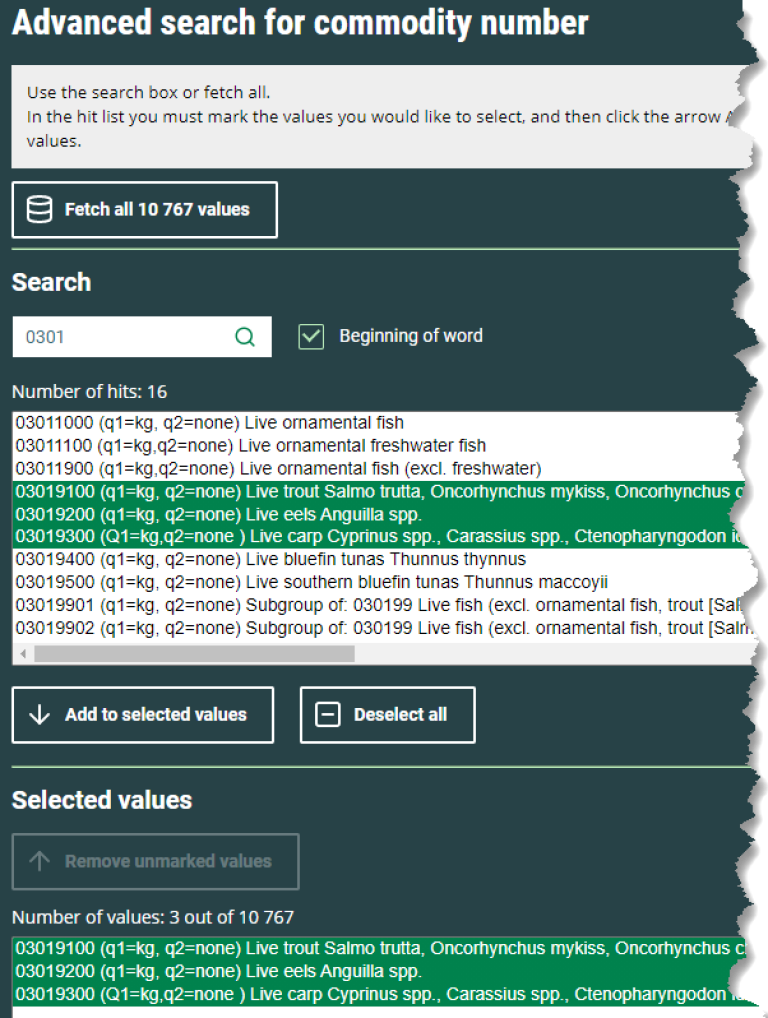
The fast solution here is to select "Fetch all ...".