Content
Published:
This is an archived release.
Fossil energy goods pulled the PPI down
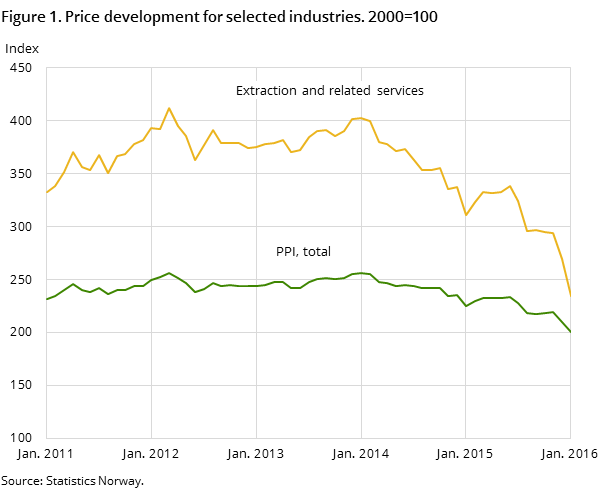
The producer price index for oil and gas, manufacturing, mining and electricity (PPI) decreased by 4.5 per cent from December 2015 to January 2016. Lower prices of fossil energy products were the main reason. A significant price increase in electricity curbed the decline in the PPI.
| Industrial Classification | Index change in per cent | Index | Weights1 | |
|---|---|---|---|---|
| December 2015 - January 2016 | January 2015 - January 2016 | |||
| 1The weights are updated annually, and are valid for the entire year. | ||||
| Extraction, mining, manufacturing and electricity | -4.5 | -10.7 | 200.4 | 1 000.0 |
| Extraction and related services | -13.1 | -24.6 | 234.1 | 405.4 |
| Mining and quarrying | -0.5 | 3.8 | 176.7 | 7.6 |
| Manufacturing | -1.3 | -1.5 | 155.3 | 544.6 |
| Food products | 1.5 | 5.8 | 173.1 | 117.0 |
| Refined petroleum products | -10.0 | -14.5 | 143.7 | 79.1 |
| Basic metals | -1.3 | -12.5 | 174.0 | 45.7 |
| Machinery and equipment | -0.8 | -0.2 | 159.0 | 59.2 |
| Electricity, gas and steam | 36.7 | 14.7 | 276.4 | 42.4 |


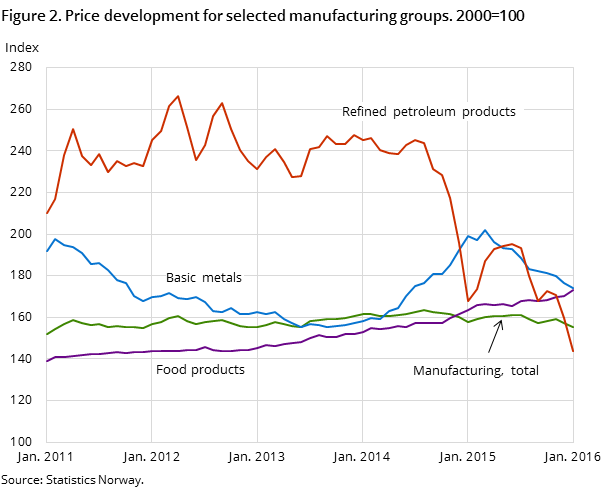
The main reason behind the decline in the overall PPI from December to January was a fall in the index for extraction of oil and natural gas of over 15 per cent. This was due to a sharp fall in prices of both commodities included in the index. The price of crude oil, Brent Blend measured in NOK, declined by almost 18 per cent, which was a continuation of the trend seen in 2015. Weaker demand in combination with the high supply of oil in the market might explain the fall in prices.
Lower prices within extraction services
Prices of services related to extraction of oil and natural gas fell by 3.1 per cent from December 2015 to January 2016. For this industry, this is a relatively strong monthly rate of change. Together with a price drop of 2.9 per cent in May last year, this was why the extraction index ended up at its lowest level in two years in January 2016. Compared with January last year, the prices were about 6 per cent lower in January this year.
Sharp increase in electricity prices in January
A significant price increase for electricity of nearly 37 per cent from December 2015 to January 2016 has curbed the decline in the total PPI. Higher consumption due to low winter temperatures in southern Norway was the main reason. Compared to January 2015, electricity was 14.7 per cent more expensive in January 2016.
Divergent price movements for manufacturing in the domestic market and export
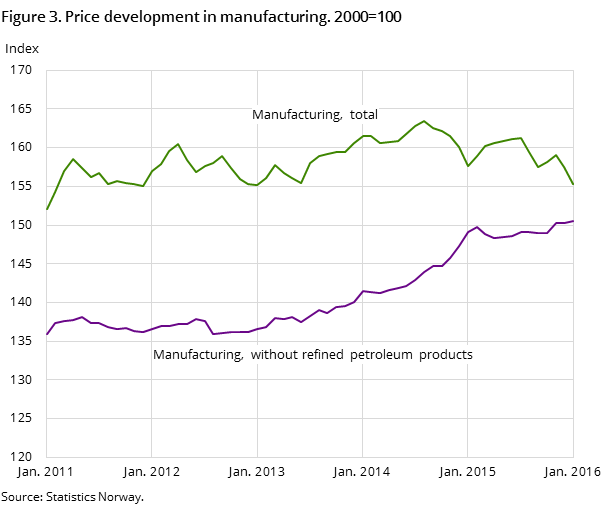
The overall index for manufacturing decreased by 1.3 per cent from December to January. The main reason was a decline in prices of refined petroleum products, which largely follow the price trend of crude oil. Higher prices of food products dampened the downturn in the manufacturing industries. Omitting refined petroleum products from the index, however, yields a slight increase of 0.1 per cent in manufacturing prices in January 2016.
Another thing that stands out is the different price development for products that Norwegian producers sell to the Norwegian market and products that are exported. Prices in all the major industrial sectors, apart from the refining industry, had a positive increase in the domestic market. In the export market, there were price declines within all the typical export industries. The exception was the index for food products, which rose sharply with higher fish prices.
Updated weights in the PPIOpen and readClose
The PPI is calculated as a weighted average of price changes. In order for the PPI to reflect Norway’s industrial structure, the weights used to compute the price indices are updated every year. The new weights are implemented with the index for January. The weights represent industries’ production values in the previous year.
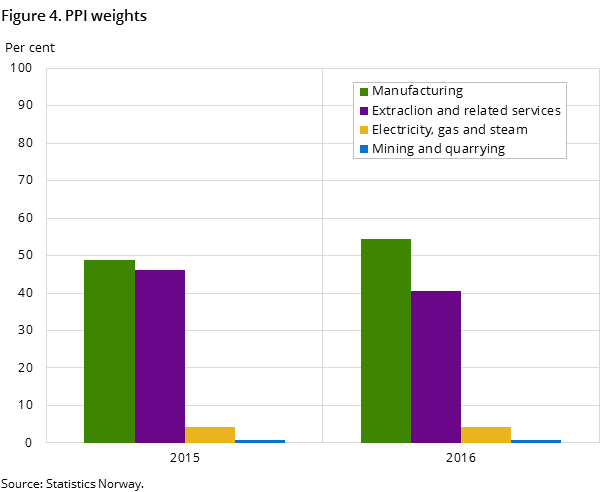
The trend from previous years, with a decline in the relative importance of oil-related industries in the Norwegian economy, is continuing in 2016. From 2015 to 2016, the weights of the industry ‘extraction of oil and natural gas’ fell from 46 to 41 per cent.
The manufacturing industries have however increased their influence on the total, up from 49 per cent in 2015 to 54 per cent in 2016. Manufacturing of food products has gained more weight and remains the biggest industry within manufacturing. Manufacturing of refined petroleum products is the second largest manufacturing group, although it has lost some weight in 2016. Machinery and equipment together with repair and installation of machinery have become more important and account for 11 per cent of the total.
The remaining weights are divided between electricity production, and mining and quarrying.
See StatBank and figure 4 for more details about the weights.
Additional information
Contact
-
Producer price index
E-mail: produsentpris@ssb.no
tel.: (+47) 21 09 40 00
-
Elisabeth Mælum
E-mail: elisabeth.maelum@ssb.no
tel.: (+47) 97 01 28 49
-
Morten Madshus
E-mail: morten.madshus@ssb.no
tel.: (+47) 40 90 26 94
-
Monika Græsli Engebretsen
E-mail: monika.graesli.engebretsen@ssb.no
tel.: (+47) 40 90 23 71
-
Håvard Georg Jensen
E-mail: havard.jensen@ssb.no
tel.: (+47) 40 90 26 86
