Content
Published:
This is an archived release.
Increase in prices of energy goods
Prices of energy goods increased substantially from March to April, contributing to a 4.1 per cent rise in the producer price index. Prices in the chemicals industry also increased, while other manufacturing industries saw moderate price changes.
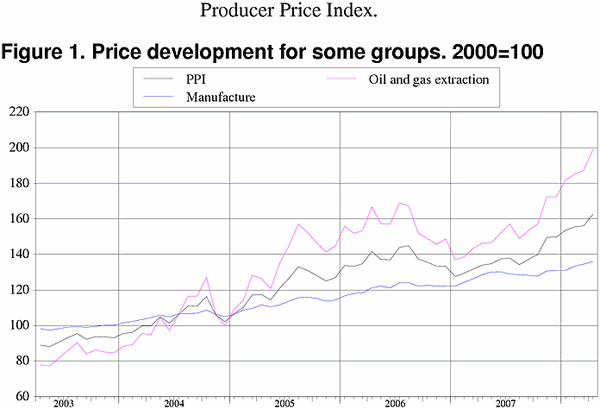
The producer price index (PPI) increased by 4.1 per cent from March to April. This was the eighth consecutive month of growth in producer prices, and the increase since August of last year is 21.2 per cent.
The index growth from March to April was mainly caused by higher prices of energy goods, which rose by 6.7 per cent. The price of crude oil keeps reaching new heights, and the average price in April was 2.8 per cent higher than that of March (Brent Blend, in NOK). Along with the oil price, prices of natural gas in continental Europe have increased steadily over the past few months. The price development of refined petroleum products also tend to be influenced by the oil price, and prices in this industry rose by 4.0 per cent from March to April. At the same time electricity prices rose sharply. Spot prices at NordPool, the Nordic power exchange, were volatile during the April and varied between regions, but overall the electricity price rose by 27.2 per cent from March to April.
The manufacturing industries experienced an overall increase in prices of 1.0 per cent. Rising prices in petroleum refining strongly affected the increase, but prices in the chemicals industry also rose significantly. The increase was 3.0 per cent, mainly caused by a 4.8 per cent rise in prices of basic chemicals. After several months of growth, these prices have increased by 11.5 per cent since November 2007. The price changes were relatively moderate in the other manufacturing industries.
Twelve-month growth: 21.3 per cent
The PPI was 21.3 per cent higher in April 2008 than in April 2007. The main reason for the strong increase was again found in the market for energy goods, with considerably higher prices of oil, electricity and petroleum products. The oil price (Brent Blend) has increased by 36.2 per cent over the past twelve months, while prices of refined petroleum products are 22.6 per cent higher than one year ago. Both these growth rates are somewhat lower than in March, reflecting the fact that the increase in prices of oil and refined products was higher last spring than they have been over the past few months. The electricity price was 65.6 per cent higher in April this year than in April last year.
Prices of food products were 3.4 per cent higher in April 2008 than in April 2007, while prices of electrical and optical equipment fell by 2.3 per cent in the same period. In the metals industry, prices fell by 5.2 per cent, largely due to a 16.3 per cent decrease in prices of non-ferrous metals.
| April 2008 | Changes, per cent | ||||||||||||||||||||||||||||||||||||||
|---|---|---|---|---|---|---|---|---|---|---|---|---|---|---|---|---|---|---|---|---|---|---|---|---|---|---|---|---|---|---|---|---|---|---|---|---|---|---|---|
| March 2008-April 2008 | April 2007-April 2008 | ||||||||||||||||||||||||||||||||||||||
| Total index | 162.6 | 4.1 | 21.3 | ||||||||||||||||||||||||||||||||||||
| Oil and gas extraction | 199.1 | 6.4 | 36.2 | ||||||||||||||||||||||||||||||||||||
| Manufacturing, mining and quarrying | 136.0 | 1.0 | 5.9 | ||||||||||||||||||||||||||||||||||||
| Electricity, gas and steam supply | 263.1 | 27.2 | 65.6 | ||||||||||||||||||||||||||||||||||||
| Main industrial groupings | |||||||||||||||||||||||||||||||||||||||
| Intermediate goods | 130.0 | 0.7 | 1.3 | ||||||||||||||||||||||||||||||||||||
| Capitals goods | 117.1 | 0.0 | 2.4 | ||||||||||||||||||||||||||||||||||||
| Consumer goods | 116.0 | 0.0 | 2.5 | ||||||||||||||||||||||||||||||||||||
| Energy goods | 201.8 | 6.7 | 35.7 | ||||||||||||||||||||||||||||||||||||
Additional information
Contact
-
Producer price index
E-mail: produsentpris@ssb.no
tel.: (+47) 21 09 40 00
-
Elisabeth Mælum
E-mail: elisabeth.maelum@ssb.no
tel.: (+47) 97 01 28 49
-
Morten Madshus
E-mail: morten.madshus@ssb.no
tel.: (+47) 40 90 26 94
-
Monika Græsli Engebretsen
E-mail: monika.graesli.engebretsen@ssb.no
tel.: (+47) 40 90 23 71
-
Håvard Georg Jensen
E-mail: havard.jensen@ssb.no
tel.: (+47) 40 90 26 86

