Content
Published:
This is an archived release.
Lower GHG emissions in 2005 and 2006
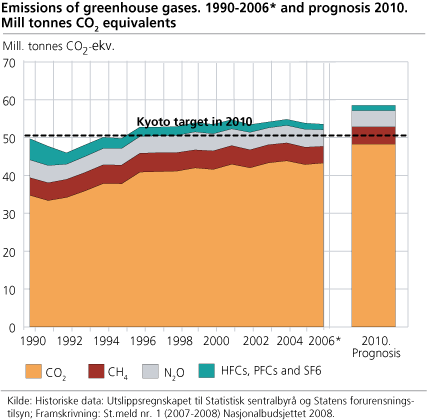
In 2005 and 2006 there was a slight decline in Norwegian greenhouse gas emissions; the emissions in 2006 were at the same level as in 2000. The reduction is mainly due to reduced activity in process industries and extraction of oil and gas. Nevertheless, the emissions in 2006 were almost 8 per cent above the 1990 level.
These are some of the results from the Norwegian emission inventory, which is produced by Statistics Norway in close cooperation with the Norwegian Pollution Control Authority. The inventory covers direct emissions from Norwegian territory (see box).
Temporary decline?
Norwegian greenhouse gas emissions totalled 53.5 million tonnes CO2 equivalents in 2006, which is on level with 2000. There was a decrease in emissions in both 2005 and 2006, following the record level of 54.8 million tonnes CO2 equivalents in 2004. Whereas the emissions in 2004 were more than 10 per cent above the 1990 level, they were less than 8 per cent higher in 2006.
In 2005 and 2006, the emissions were reduced by more than 2 per cent, mainly due to lower oil production on the continental shelf, but also reduced production, operation standstills and environmental measures in parts of the emission-intensive industries. However, the decrease is not expected to continue in the following years due to the new gas power plant at Kårstø and the LNG plant on Melkøya, which became operative in 2007, In addition, the gas power plant at Mongstad is expected to become operative in 2010. Altogether, the three plants are expected to emit 2-3 million tonnes CO2 equivalents per year, which in itself corresponds to a 6 per cent increase compared to 1990. The future development in emissions from oil and gas extraction is uncertain, whereas emissions from transport are expected to rise the coming years.
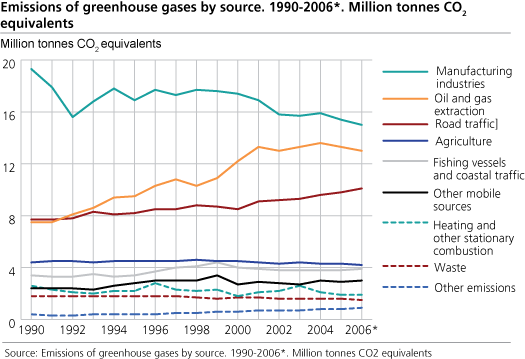
The three largest emission sources, oil and gas activities, process industries and transport, were together responsible for almost 82 per cent of the Norwegian emissions. The remainder came from agriculture (8 per cent), heating of buildings (4 per cent), waste (3 per cent), fishing (2 per cent) and energy production (1 per cent). These smaller sources have remained at a comparatively stable emission level since 1990.
Large emissions from gas turbines on the continental shelf
In 1990, greenhouse gas emissions from extraction of oil and gas totalled somewhat more than 7.5 million tonnes CO2 equivalents. In 2006, this had increased to approximately 13 million tonnes, i.e. 0.6 million tonnes CO2 equivalents less than the record level in 2004.
9.6 of the 13 million tonnes CO2 equivalents emitted from the petroleum sector in 2006 originated from gas turbines that supply oil platforms with energy. The rest of the emissions were mainly a result of flaring (1 million tonnes CO2 equivalents) and emissions from gas terminals onshore (1.2 million tonnes CO2 equivalents).
Substantial, but decreasing emissions from fertilizer and metal production
While the emissions from oil and gas activities on the Norwegian continental shelf have increased considerably since 1990, emissions from manufacturing industries have had the opposite development. Manufacturing industries emitted more than 19.3 million tonnes CO2 equivalents in 1990, but in 2006 these emissions were reduced to 15 million tonnes CO2 equivalents.
More than half of these emissions come from the production of metals and fertilizer (5.5 and 2.4 million tonnes CO2 equivalents, respectively). The emission reduction is due to lower production, shutting down of plants and environmental measures. The changeover to less polluting production technology and improved process management has for instance reduced the emissions of PFCs (perfluorocarbons) from aluminium production. In spite of these emission reductions, the manufacturing industries were still responsible for more than a quarter of Norwegian greenhouse gas emissions in 2006.
Transport - an increasingly important emission source
The growing prosperity in Norway has caused more travelling, both privately and professionally. In addition, the growth in trade has led to more goods being transported from the production location to the consumers. Norwegian transport is mainly based on fossil fuels, such as diesel and petrol, and the increase in traffic has therefore resulted in transport becoming a main source of greenhouse gas emissions.
In total, emissions from transport equalled 17 million tonnes CO2 equivalents in 2006. This includes road traffic (10.1 million tonnes CO2 equivalents), domestic sea transport and fishing (3.9 million tonnes CO2 equivalents), domestic air transport (1 million tonne CO2 equivalents), plus some minor sources.
In 1990, emissions from traffic on Norwegian roads equalled 7.7 million tonnes CO2 equivalents, of which 25 per cent came from goods traffic. In 2006, this had increased to 10.1 million tonnes, of which goods traffic accounted for 30 per cent. However, the increase in emissions has been lower than the increase in transport. Improved energy efficiency in vehicles makes it possible to transport more goods and more persons using less fuel.
CO2 is the main problem
Greenhouse gases include the six gases covered by the Kyoto Protocol (see box): carbon dioxide (CO2), methane (CH4), nitrous oxide (N2O) hydrofluorocarbons (HFCs), perfluorocarbons (PFCs) and sulphur hexafluoride (SF6). In 2006, CO2 accounted for more than 80 per cent of the greenhouse gas emissions measured by tonnes of CO2 equivalents, whereas methane and nitrous oxide accounted for almost 17 per cent. Fluorinated gases accounted for 3 per cent of the total emissions in 2006. Since 1990, CO2 emissions have increased by 25 per cent, CH4 and N2O have fallen by 5 and 7 per cent, respectively, whereas emissions of fluorinated gases have fallen by 74 per cent.
Preliminary emission figures for greenhouse gas emissions in 2007 will be published on 13 May 2008 on www.ssb.no .
The Kyoto Protocol and Norway's commitment178 countries have so far ratified the Kyoto Protocol (12 December 2007). Of these, 36 industrialised countries, including Norway, have been given so-called AAU quotas (assigned amount units) for the period 2008-2012. If the countries' emissions are larger than the assigned amounts they must buy quotas through the so-called Kyoto mechanisms in order to supplement national emission reductions. This may imply buying quotas assigned to other industrialised countries or financing approved projects for emission reduction in developing countries (CDM - Clean Development Mechanism). Norway's assigned amount for the period 2008-2012 is 250.6 million tonnes CO2 equivalents (1 per cent more than the 1990 emission for each year 2008-2012). In 2006, Norway's greenhouse gas emissions totalled 53.5 million tonnes CO2 equivalents. Projections from the Norwegian Government indicate that Norway's emissions may rise to 58.51 million tonnes CO2 equivalents in 2010. If the emissions remain on the 2010 level throughout the Kyoto period, Norway will need to buy quotas for 42 million tonnes CO2 equivalents in the period 2008-2012. 1Prognosis: Report No. 1 (2007-2008) to the Storting: The National Budget 2008. |
Emissions from Norwegian territoryFigures from the emission inventory presented here are in line with the Kyoto Protocol definition of ”Norwegian emissions”. This means that all emissions from activities on Norwegian territory are covered, including emissions from the production of goods for export. For instance, this applies to emissions from the production of oil and gas on the Norwegian continental shelf, which in 2006 accounted for one quarter of the total Norwegian greenhouse gas emissions. The majority of the oil and gas that is extracted is exported and not used by Norwegians. All the same, these emissions are defined as Norwegian in the inventory. Similarly, emissions from the production of imported goods are not included. These emissions are included in the inventory of the country of origin. |
Other relevant articles
Reduced emissions of hazardous substances
Documentation
Tables:
Contact
-
Trude Melby Bothner
E-mail: trude.melby.bothner@ssb.no
tel.: (+47) 40 81 14 25
-
Berit Storbråten
E-mail: berit.storbraten@ssb.no
tel.: (+47) 40 81 14 23


![Emissions of greenhouse gases. 1990-2006*. Index 1990=1.0]](/a/en/static/klimagassn_en/fig-2008-02-12-02-en.gif)