Content
Published:
This is an archived release.
Less waste sent to material recovery
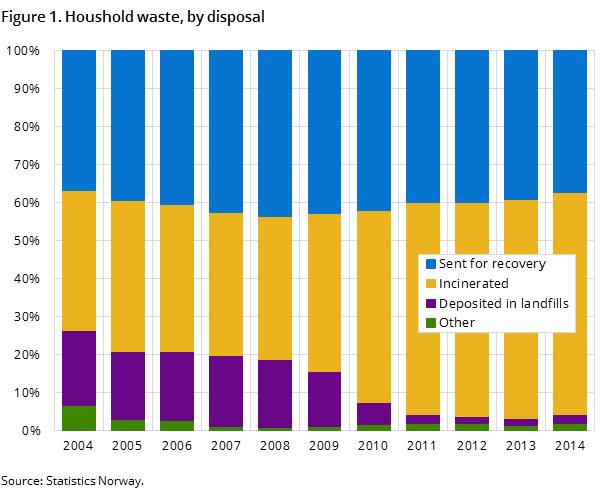
Municipalities handled 2.3 million tonnes of household waste in 2014, about the same as in 2013. Around 37 per cent of the waste was either sent to material recovery, biogas production or composting. There has been a steady decline in waste sent to material recovery from 2008 to 2014.
| Total | Per cent | ||||
|---|---|---|---|---|---|
| 2008 | 2013 | 2014 | 2008 - 2014 | 2013 - 2014 | |
| 1The figures have been adjusted to correct for interference of industrial waste in household waste | |||||
| 2Sent to material recovery includes composting and fermentation | |||||
| Total 1 000 tonnes | 2 083 | 2 255 | 2 264 | 9 | 0 |
| Kg per inhabitant | 434 | 441 | 438 | 1 | -1 |
| Sent to material recovery. 1000 tonnes.2 | 906 | 885 | 846 | -7 | -4 |
| Sent to material recovery. Kg per inhabitant.2 | 189 | 173 | 164 | -13 | -5 |
| Income from fees per inhabitant (NOK) | 780 | 946 | 942 | 21 | 0 |


On average, each inhabitant generated 438 kg of household waste in 2014. This is a decrease of 4 kg from 2013, but still double the volume of 20 years ago. On the other hand, sorting of waste is also 6 times that of 20 years ago.
Recovery rate is decreasing
The waste sent to energy and material recovery constitutes 1.9 million tonnes, or 82 per cent of all household waste in 2014, which is a smaller share than in 2013. The amount of waste sent to energy recovery includes about 160 000 tonnes of mixed waste exported for energy recovery.
Incineration gains ground
Treatment of rising amounts of waste from households is managed by incineration plants. In 2014, around 1.3 million tonnes of household waste was incinerated, and this is twice as much as in 2004. Approximately 965 000 tonnes of the incinerated waste was mixed waste, and the remaining 350 000 tonnes was sorted waste, and mainly wood waste.
Waste amount increasing less than consumption
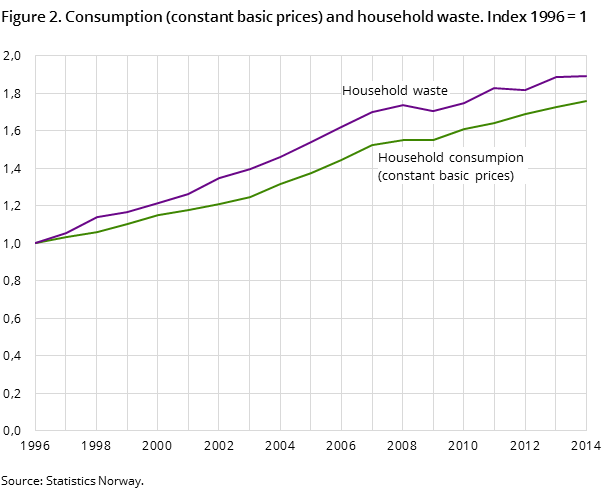
The figures show a connection between consumption and waste generation. In the years up to 2008, the amount of household waste increased on average 5 per cent each year, which was more than the consumption volume. In the last five years, the increase in average waste amount was less than the consumption volume. From 2013 to 2014, consumption increased by 1.9 per cent, whilst the waste generation increased by 0.4 per cent.
For every NOK 1 000 spent on consumption, Norwegians generate 2 kg of household waste.
Edible food thrown away
Around 182 000 tonnes of food waste and other materials were sorted for composting and fermentation in 2014. This is 8 000 tonnes more than the year before. In 120 municipalities, the food waste is incinerated together with mixed waste. According to a survey conducted jointly by Mepex, Østlandsforskning and Statistics Norway in 2011, on average each inhabitant discarded 78 kg of food waste, of which 46 kg was edible. The remaining was peel, coffee grounds and other inedible substances.
Svalbard generates less waste
The inhabitants in Longyearbyen on average throw away 200 kg of household waste. Mainland inhabitants discard more than twice as much in a year. All households in Longyearbyen have installed food waste disposers. This reduces the waste amount. Other explanations for the low amounts of waste could be that the inhabitants regularly do not stay for several years and live in quite small apartments.
About average in Europe
Norway generated 496 kg of municipal waste per capita in 2013, and this is 15 kg more than the European average. Municipal waste is the sum of waste from households and the household-like waste from industries handled by the municipalities.
Comparisons between countries may be uncertain since the coverage and managing of municipal waste varies within the EU.
Fee calculation basis unchanged
Costs in the municipal waste sector are covered by fees paid by the users of the service. Regulations stipulate that fees shall cover all the costs in the municipal waste service, and cannot exceed the actual costs for providing that service, i.e. self cost principle. Accurately calculating income from fees to cover the real calculation basis in a single year is complicated, thus the municipalities are allowed to decide on fee levels so that income from fees over a five-year period equals the fee calculation basis.
For 2014, the fee calculation basis per inhabitant has increased by 4 per cent compared to 2013. The income per habitant from the fees decreased by 2 per cent compared to 2013.
The income from fees in 2014 was about 8.4 per cent lower than the fee calculation basis for that year. For the whole five-year period from 2010 to 2014, total income from fees was about 3 per cent lower than the fee calculation basis.
Textiles for reuse are no longer counted as wasteOpen and readClose
From 2011 onwards, textiles for reuse are no longer counted as waste. This causes a break in the time series, and the total amount of household waste is about one per cent lower than if the textiles for reuse were included.
Recovery targetsOpen and readClose
There is a national goal of 80 per cent recovery. This goal however, pertains to all waste and not only household waste. The goals were last updated in a waste strategy from 2013.
In 2012, the average share of energy recovery was 78 per cent. The numbers for 2014 are calculated based on the same rate.
Contact
-
Camilla Skjerpen
E-mail: camilla.skjerpen@ssb.no
tel.: (+47) 48 22 72 14
-
Mona E. Onstad
E-mail: mona.onstad@ssb.no
tel.: (+47) 48 59 61 86
