Content
Published:
This is an archived release.
Amount has doubled in 20 years
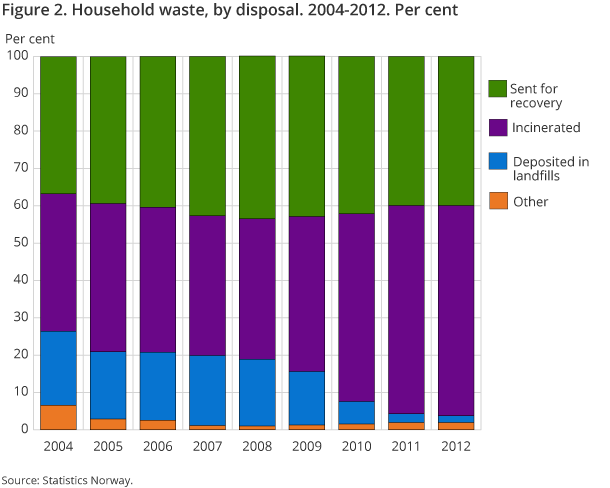
The municipalities handled 2.2 million tonnes of household waste in 2012, which is about twice that of 1992. Waste sent to material recovery constitutes 40 per cent of total waste last year, which is almost the same as for 2011.
| 1992 | 2011 | 2012 | 1992- 2012 | 2011 - 2012 | |
|---|---|---|---|---|---|
| 1The figures have been adjusted to correct for interference of industrial waste in household waste | |||||
| 2Sent to material recovery includes composting and fermentation | |||||
| Total. 1000 tonnes. | 1 012 | 2 183 | 2 172 | 115 | -0.5 |
| Kg per inhabitant | 237 | 438 | 430 | 82 | -2 |
| Sent to material recovery. 1000 tonnes.2 | 86 | 871 | 866 | 908 | -1 |
| Sent to material recovery. Kg per inhabitant.2 | 20 | 172 | 169 | 741 | -2 |
| Income from fees per inhabitant (NOK) | 917 | 917 | 0 | ||
Of 2.2 million tonnes of household waste collected, about 1.8 million tonnes were used for material or energy recovery.
Consumption increases, but waste amount per capita decreases
Each inhabitant generated 430 kg of household waste in 2012. This is 8 kg less than in 2011. The total amount of household waste generated in Norway had an insignificant decrease, and the reduction in waste per capita is caused by an increase in the population.
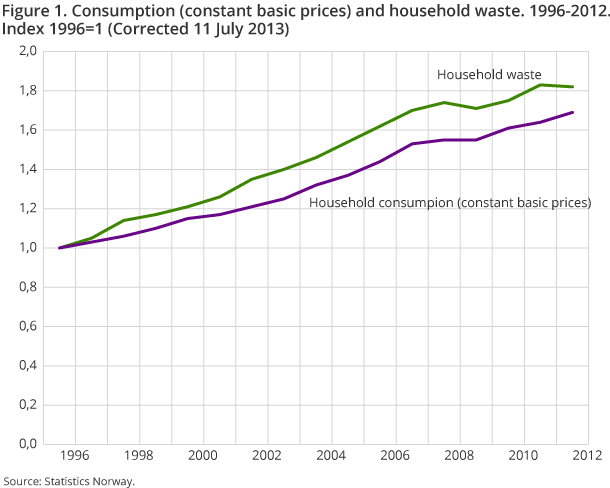
The figures show a connection between consumption and waste generation. The consumption increased by 1.3 per cent in 2012, whilst the waste generation decreased by 0.5 per cent. The waste amount increased until 2008 by an average of 6 per cent each year, and this was a larger growth than the consumption. From the years 2008 onwards, we can see a change, with no increase in the waste amount and an average growth of 1.4 per cent for consumption.
Small changes in managing waste
Waste to incineration has increased by about 440 000 tonnes compared to 2008, which was the year before the ban on land filling of biodegradables came into force. In 2012, 290 000 tonnes of the 1.2 million tonnes of waste that was incinerated was sorted waste, mainly wood waste. Approximately 940 000 tonnes was mixed waste.
Compared to 2011, 9 000 1 tonnes less waste was sent to material recovery.
Less waste on landfills decreases the emissions
The figures show that the ban on biodegradable waste gives positive results. A total of 40 000 tonnes of household waste was land filled in 2012, and this is a ninth compared to 2008.
Methane from landfills makes up about 2 per cent of all emissions of greenhouse gases in Norway, or about 1 million tonnes of CO2 equivalents – a reduction of 0.8 million tonnes from 1990.
Share of waste to material recovery unchanged
The waste sent to energy and material recovery constitutes 1.8 million tonnes, or 83 per cent of all household waste in 2012, which is the same share as for 2011. The amount of waste sent to energy recovery covers 160 000 tonnes of mixed waste exported for energy recovery.
Around the average in Europe
Norway generated 483 kg of municipal waste per capita in 2011, which is 17 kg less than the average in Europe. Municipal waste is the sum of waste from households and the household-like waste from industry handled by the municipalities.
Comparisons between countries may be uncertain since the coverage and management of municipal waste varies within the EU.
No change in fee calculation basis
In 2012, the fee calculation basis was equal to 2011, whilst there has been an increase of 17.5 per cent since 2008. The income from fees has had the same growth, with an increase of 17 per cent from 2008.
Municipal costs in the municipal waste sector are covered by fees paid by the users of the service. Regulations stipulate that fees shall cover all the costs of the service, but they cannot exceed the municipality’s actual costs for providing that particular service (“self cost”). Accurately stipulating income from fees to cover the real calculation basis in a single year is complicated. The municipalities are therefore allowed to determine fee levels whereby the income from fees over a five-year period equals the fee calculation basis.
The income from fees is about 3 per cent lower than the fee calculation basis in 2012. For the whole five-year period from 2008 to 2012 this has evened out. The total of income from fees and fee calculation basis for 2008-12 is almost equal, with income from fees a slight 0.5 per cent lower than the fee calculation basis.
1 The figure was corrected, 11.07.2013.
Textiles for reuse are no longer counted as wasteOpen and readClose
From 2011 onwards, textiles for reuse are no longer counted as waste. This causes a break in the time series, and the total amount of household waste is about one per cent lower than if the textiles for reuse were included.
Contact
-
Camilla Skjerpen
E-mail: camilla.skjerpen@ssb.no
tel.: (+47) 48 22 72 14
-
Mona E. Onstad
E-mail: mona.onstad@ssb.no
tel.: (+47) 48 59 61 86


