Content
Published:
This is an archived release.
Continued slow growth in household income
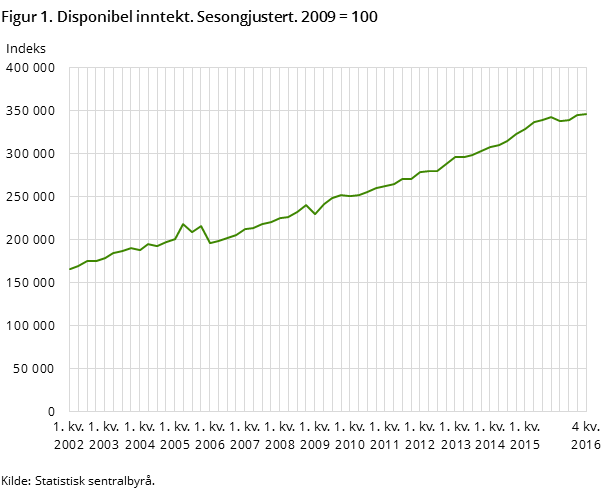
Disposable income in households increased by 0.6 per cent from the previous quarter according to seasonally-adjusted figures. Consumption increased more, thus leading to lower savings in the same period.
| 1st quarter 2016 | 2nd quarter 2016 | 3rd quarter 2016 | 4th quarter 2016 | |
|---|---|---|---|---|
| Compensation of employees | 367 961 | 368 245 | 375 897 | 375 519 |
| Disposable income | 337 849 | 339 216 | 344 442 | 346 465 |
| Consumption | 330 024 | 333 205 | 334 318 | 336 696 |
| Saving | 26 237 | 23 440 | 28 696 | 28 191 |
| Savings ratio (per cent) | 7.4 | 6.6 | 7.9 | 7.7 |
| Real disposable income, growth | -4.2 | 1.4 | 1.7 | -0.4 |


Households’ disposable income went up just over NOK 2 billion from the 3rd to the 4th quarter of 2016, according to seasonally-adjusted figures. Compensation of employees remained unchanged, while payments and benefits received from general government, mostly work-related benefits, increased by NOK 2 billion. Property income received increased more than property income paid and contributed to a higher disposable income.
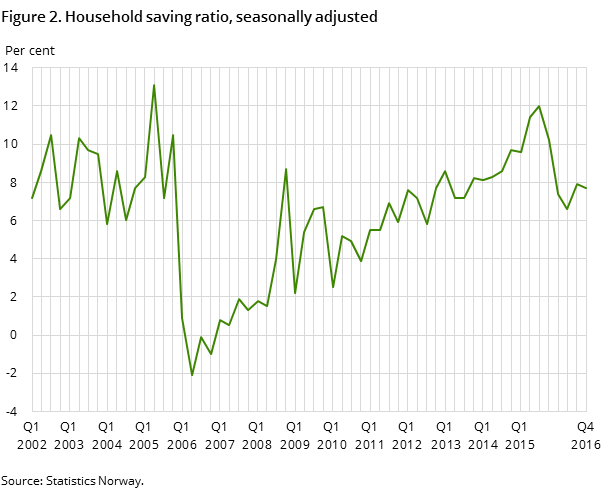
Final consumption expenditure increased slightly more than disposable income, and with unchanged adjustment for changes in pension entitlements, household savings decreased in the 4th quarter. The seasonally-adjusted savings rate was 7.7 per cent.
Decreased real disposable income in 2016
Preliminary figures show that households’ disposable income was up 1.5 per cent in 2016 compared with the previous year. Adjusted for population growth, the increase was just 0.6 per cent, which corresponds to a disposable income per capita of NOK 261 000. Households’ saving amounted to NOK 105 billion in 2016. Saving per capita was about NOK 20 000. The yearly savings rate for households was 7.3 per cent, clearly lower than 10.8 per cent in 2015. However, the savings ratio in 2016 is just 1 percentage point lower compared to the average over the past five years.
Increased income for non-financial corporations
The operating surplus of non-financial corporations has decreased over the last years, and the negative trend continued in 2016. Compared to 2015, the operating surplus was NOK 70 billion lower. Reduced property income paid and lower taxes contributed to an increased disposable income and net lending.
Income in the general government decreased in 2016, especially due to reduced petroleum-related taxes. Growth in property income received was also negative compared to 2015. Payments and benefits to household and consumption expenditure increased, leading to savings in general government of NOK 161 billion in 2016, which is NOK 80 billion lower than the previous year.
Lower disposable income for Norway
Norway's real disposable income in 2016 decreased 2.9 per cent, mainly due to a deterioration in the terms of trade. The price development of oil and gas contributed 4.1 percentage points to this decline. The change in terms of trade contributed overall with 4.3 percentage points of the decline. Production growth in the petroleum industry and on the mainland helped, however, to push up real disposable income by 1 percentage point, while changes in income and transfers of balance of payments contributed to the increase in real disposable income by 0.4 percentage points.
For more on contributions to real disposable income, see Table 41 below annual national accounts.
Figures for the 1st to 4th quarter of 2015 and 1st to 3rd quarter of 2016 have been revised
In connection with the release of figures for the 4th quarter of 2016, new information has been incorporated for all quarters from the 1st quarter of 2016. In addition, new figures for petroleum-related taxes in 2015 have been revised.
RevisionsOpen and readClose
Quarterly sector accounts are based on preliminary calculations. The uncertainty in the last quarter is the largest. New information is continuously being integrated into the figures, which could cause revisions in the previously released data. Quarterly sector accounts are also consolidated against the data from the quarterly national accounts data. When the last quarters of the unadjusted series are updated, seasonally-adjusted series may also be revised backwards.
Additional information
Contact
-
Pål Sletten
E-mail: pal.sletten@ssb.no
tel.: (+47) 99 29 06 84
-
Nils Amdal
E-mail: nils.amdal@ssb.no
tel.: (+47) 91 14 91 46
