Content
Published:
This is an archived release.
Weak, but increasing GDP growth in Mainland Norway
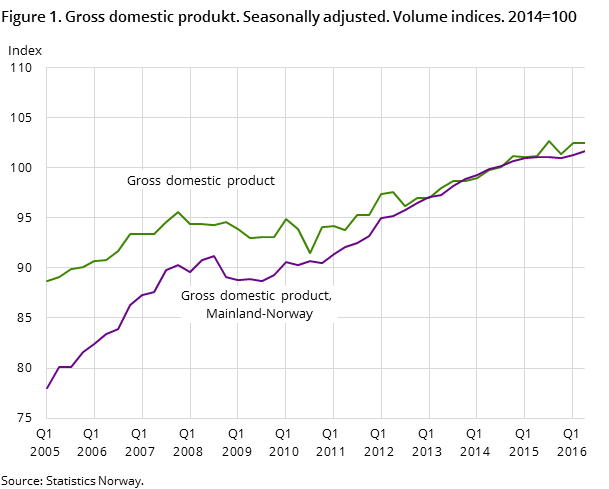
Gross domestic product (GDP) for Mainland Norway rose 0.4 per cent in the 2nd quarter of 2016, according to seasonally-adjusted figures. This is a slight increase from the 0.3 per cent growth in the 1st quarter and the zero growth in the second half of last year.
| 2015 | 3rd quarter 2015 | 4th quarter 2015 | 1st quarter 2016 | 2nd quarter 2016 | |
|---|---|---|---|---|---|
| 1Figures from 2015 onwards are preliminary. | |||||
| Gross domestic product | 1.6 | 1.5 | -1.3 | 1.0 | 0.0 |
| Gross domestic product Mainland Norway | 1.1 | 0.1 | -0.1 | 0.3 | 0.4 |
| Petroleum activities and ocean transport | 3.7 | 7.5 | -5.8 | 4.2 | -1.4 |
| Final domestic use of goods and services | 0.7 | -0.8 | 0.5 | 2.1 | -0.4 |
| Final consumption expenditure of households and NPISH | 2.1 | 0.1 | 0.5 | 0.5 | 0.4 |
| Final consumption expenditure of general government | 2.1 | 0.4 | 0.6 | 0.6 | 0.6 |
| Gross fixed capital formation (GFCF) | -3.8 | 0.7 | -0.6 | -1.6 | 0.1 |
| Total exports | 3.7 | 6.1 | -2.2 | -2.7 | -0.3 |
| Total imports | 1.6 | 0.5 | 2.9 | -0.9 | -1.7 |
| Employed persons | 0.3 | 0.0 | -0.2 | -0.1 | -0.1 |
| Total hours worked | 0.3 | -0.2 | -0.2 | -0.3 | -0.5 |


Electricity production fell appreciably in the 2nd quarter, after a strong rise in the previous quarter. The decline softened the growth in Mainland Norway by more than 0.1 percentage point.
Value added in manufacturing and mining was down 0.9 per cent in the 2nd quarter. Manufacturing has had a negative development since the autumn of 2014, but the decline is now weaker. In oil-related manufacturing industries there is a mixed picture of trends, with a decline in some industries and an increase in others. For example, growth is seen in the shipbuilding industry. Among other goods-producing industries there was a marked growth in construction, while traditional fishing and aquaculture saw a slight reduction.
There was a mixed picture among the service industries. Preliminary figures show growth in services related to oil operations and merchandising. The activity in hotels and restaurants remained at a high level in the 2nd quarter despite the hotel strike in May. Other areas such as business services continued to decline. Value added in the public sector increased by 0.3 per cent.
Value added in extraction as well as transport via pipelines of oil and gas declined in the 2nd quarter and contributed to the total GDP remaining unchanged from the 1st quarter.
Households: moderate consumption growth – significant increase in dwelling investments
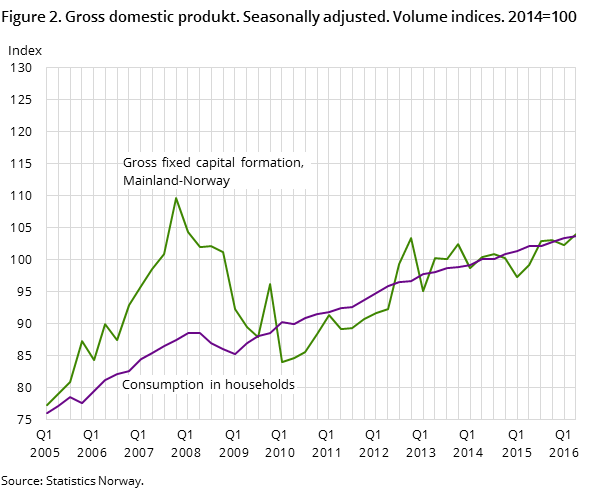
Household consumption rose by 0.4 per cent in 2nd quarter after rising 0.6 per cent in the previous two quarters. Consumer spending was unchanged from the 1st to 2nd quarter, while spending on services increased. Household consumption abroad was at the same level in the 2nd quarter as in the previous quarter.
Household investment in dwellings has risen steadily since late 2014 and increased by 2.3 per cent in the 2nd quarter of 2016.
Consumption in general government has grown steadily by 0.6 per cent over the last three quarters, with the strongest growth in central government. Fixed capital formation in general government grew slightly in the 2nd quarter after a decline in the previous two quarters.
Investment level unchanged
Total gross fixed capital formation grew by 0.1 per cent in the 2nd quarter this year after falling more or less consistently over a long period. Preliminary figures show a continued decline in petroleum investments, particularly in exploration and production drilling, while investments in platforms increased. In Mainland Norway, investments rose – primarily in the service industries. Investments in manufacturing were reduced by 1.2 per cent, following a stronger decline in the 1st quarter.
Weak development in exports
Exports of traditional goods decreased in volume by 0.4 per cent in the 2nd quarter, following a marked decline in the previous quarter. As in the previous quarter, exports of refined oil products contributed to the decline, which is probably not particularly driven by the business cycle. A decrease for machinery and other products can also be connected with the fall in petroleum-related demand overseas. The largest volume increase is found in food products and basic chemicals, chemical and mineral products. This may be due to improvements in cost competitiveness. Exports of oil and gas fell 1.8 per cent in the 2nd quarter. Preliminary estimates for exports of services, however, show a growth of 2.1 per cent in the 2nd quarter after a clear decline in the previous quarter.
Imports of traditional goods fell by 2.4 per cent after a decline in the previous quarter. Preliminary figures for imports of services show a decline of 2.0 per cent from the 1st to 2nd quarter of 2016.
Employment down
Preliminary calculations show that employment fell by 0.1 per cent in the 2nd quarter of 2016. This is equivalent to approximately 3 100 persons. There was a similar fall in employment in the three preceding quarters. In the 2nd quarter, the number of hours worked decreased by 0.5 per cent.
Figures revised for all quarters for 2014
In conjunction with the release of figures for the 2nd quarter of 2016, the base year is updated with new information from the final national accounts for 2014. In addition, new information is incorporated for all quarters from the 1st quarter of 2015. The new figures for 2015 show a growth in GDP mainland Norway at 1.1 per cent annually, which is 0.1 percentage point higher than the previous estimate. For a discussion of revisions in other sizes, see Annual national accounts. Only small changes are seen in the seasonally-adjusted growth in GDP Mainland Norway as a result of the new information. Growth in the 1st quarter of 2016 is unchanged from the previous publication.
An overview of the revisions in macroeconomic variables is listed in Appendix Table no. 48.
For an overview of developments in the gross domestic product for some of our trading partners, see the statistics from the OECD.
Concepts and definitions in National AccountsOpen and readClose
For more information about definitions of the main concepts, variables and classifications in national accounts, see About the statistics, definitions.
How the figures are calculatedOpen and readClose
The sum of four quarters in the Quarterly National Accounts (QNA) makes up the preliminary annual figures until the Annual National Accounts (ANA) for year t are published in November in year t+2 and incorporated as a new base year in the QNA.
Note that in the time series in volume, the figures from the base year and onwards are fixed price figures, while data prior to the base year are chained volume figures. This implies that additivity in volume is lost prior to the base year.
Contact
-
Pål Sletten
E-mail: pal.sletten@ssb.no
tel.: (+47) 99 29 06 84
-
Ingunn Sagelvmo
E-mail: ingunn.sagelvmo@ssb.no
tel.: (+47) 40 90 26 32
-
Pia Tønjum
E-mail: pia.tonjum@ssb.no
tel.: (+47) 48 99 12 07
-
Kristian Gimming
E-mail: kristian.gimming@ssb.no
tel.: (+47) 91 88 39 06
