Content
Published:
This is an archived release.
Small decrease in value added
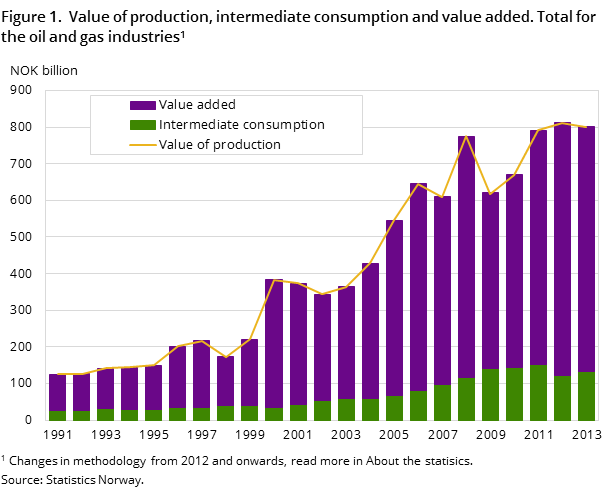
A fall in the production of crude oil and natural gas in 2013 contributed to a decrease of 1 per cent in the production value in the oil and gas industries. Combined with an increase in the intermediate consumption, the value added decreased by 3 per cent.
| 2012 | 20131 | Change in per cent | ||
|---|---|---|---|---|
| NOK million/number | NOK million/number | Share | 2012 - 2013 | |
| 1Preliminary figures. | ||||
| Total value of production | 811 393 | 801 421 | 100 | -1.2 |
| Extraction of oil and natural gas, incl. transport via pipelines | 697 867 | 666 264 | 83.1 | -4.5 |
| Support activities for petroleum and natural gas extraction | 113 526 | 135 157 | 16.9 | 19.1 |
| Intermediate consumption, total | 122 245 | 132 863 | 100 | 8.7 |
| Extraction of oil and natural gas, incl. transport via pipelines | 49 792 | 47 132 | 35.5 | -5.3 |
| Support activities for petroleum and natural gas extraction | 72 453 | 85 731 | 64.5 | 18.3 |
| Value added, total | 689 149 | 668 559 | 100 | -3.0 |
| Extraction of oil and natural gas, incl. transport via pipelines | 648 075 | 619 133 | 92.6 | -4.5 |
| Support activities for petroleum and natural gas extraction | 41 074 | 49 426 | 7.4 | 20.3 |
| Total employees | 57 046 | 63 006 | 100 | 10.4 |
| Extraction of oil and natural gas, incl. transport via pipelines | 25 625 | 27 206 | 43.2 | 6.2 |
| Support activities for petroleum and natural gas extraction | 31 421 | 35 800 | 56.8 | 13.9 |


The oil and gas activity in Norway consists of the extraction of crude oil and natural gas, pipeline transport and support activities for petroleum and natural gas extraction. The production value for these three industries amounted to NOK 801 billion in 2013, a decrease of 1 per cent from the previous year. The intermediate consumption showed an increase of 9 per cent in the same period and amounted to NOK 133 billion in 2013. This resulted in a value added of NOK 668 billion in 2013, which is 3 per cent lower than in 2012.
Fall in the extraction industry
The production value in the extraction industry (including pipeline transport) decreased in 2013 by almost 5 per cent from 2012 and ended up at NOK 666 billion. The lower production value was mainly caused by a 5 per cent decrease in the production of crude oil and natural gas, measured in tonnes, in addition to a moderate decrease in the oil prices. A 5 per cent increase in gas prices counteracted the decrease.
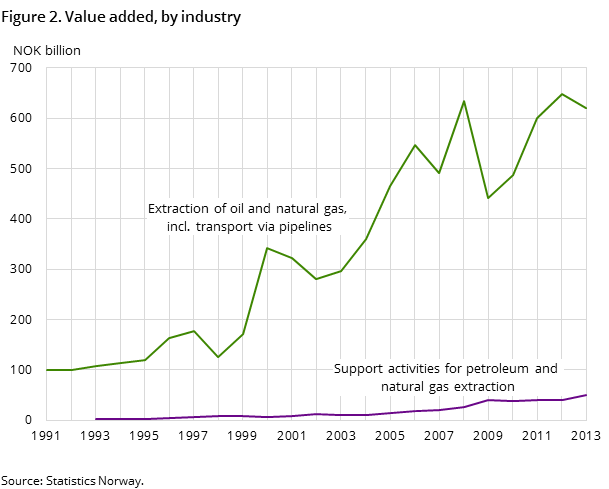
Compared to the production value, the intermediate consumption makes up a small amount within the extraction and pipeline industries. In 2013, the intermediate consumption was NOK 47 billion and made up only 7 per cent of the production value. This resulted in a value added of NOK 619 billion in 2013, a decrease of almost 5 per cent from the year before.
The investments in the extraction and pipeline industries increased by 22 per cent from 2012, to NOK 212 billion in 2013, see the investment statistics.
Large increase in the oil service industry
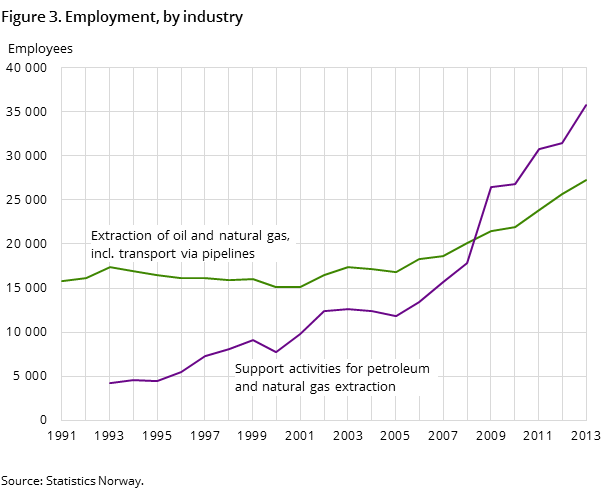
In 2013, the production value in the oil service industry was NOK 135 billion, an increase of 19 per cent from 2012. The value added had an increase of 20 per cent, and was NOK 49 billion in 2013. With almost 36 000 employees, the oil service industry has the largest share of employees of the oil and gas activities.
The investments in the oil service industry were halved from 2012 and ended at nearly NOK 5 billion in 2013. The investments mainly consist of the purchase and sale of rigs and drilling vessels.
Change in methodologyOpen and readClose
Extraction and pipeline transport
Major changes were made to the methodology from 2011 to 2012, in addition to some corrections. The reasons for the method changes are the main revision of the national accounts in 2014, access to new price data, and a general review of the calculations. See 'About the statistics' for more details.
Oil service industry
In 2013, several enterprises were reclassified from other industries to the oil service industry. This contributed to the growth in the industry from 2012 to 2013. The reclassifications reflect an altered assessment of the firms' main activity, not a change in the activity itself.
As from 2012, ancillary services are not included in the statistics for service industry. An ancillary activity is performed only to other businesses in the same enterprise and/or other entities in the group.
Additional information
Contact
-
Maria Asuncion Campechano
E-mail: maria.campechano@ssb.no
tel.: (+47) 40 81 14 21
-
August Meland
E-mail: august.meland@ssb.no
tel.: (+47) 46 42 33 21
