Content
Published:
Updated:
This is an archived release.
The figures for own consumption of self produced gas were incorrect. Total figures were by consequence affected. The figures have been corrected and the text, tables and figures have been republished.
Decreased energy use in manufacturing
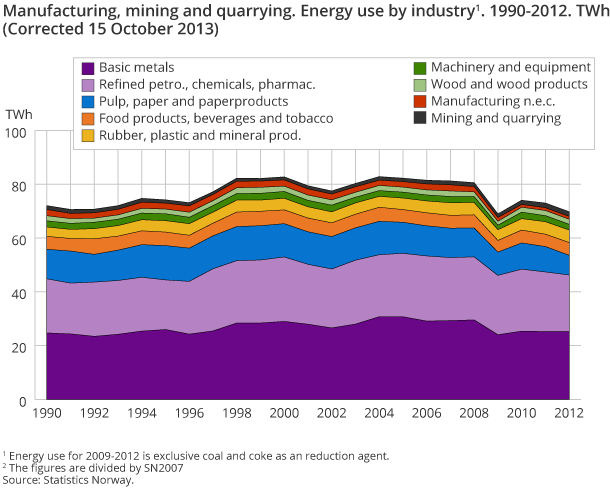
Total energy use in manufacturing, mining and quarrying amounted to 76 618 GWh in 2012. The preliminary figures show a decrease of 3.9 per cent compared to 2011, mainly due to closures and temporary shutdowns.
| Total energy consumption | Energy costs | |||
|---|---|---|---|---|
| Gwh | Per cent | NOK million | Per cent | |
| 20122 | 2011 - 2012 | 20122 | 2011 - 2012 | |
| 1Published data are based on SN07. | ||||
| 2Preliminary figures | ||||
| Corrected 15 October 2013. | ||||
| 05,07,08,09.9,10-33 Manufacturing, mining and quarrying | 76 618 | -3.9 | 19 971 | -8.3 |
| 05,07,08,09.9 Mining and quarrying | 1 717 | -0.5 | 1 007 | -1.6 |
| 10-33 Manufacture | 74 901 | -4.0 | 18 964 | -8.7 |
| 10-12 Manufacture of food products and beverages | 4 736 | 3.2 | 2 468 | -2.1 |
| 16 Wood and wood products | 1 880 | -1.7 | 526 | -8.4 |
| 17 Paper and paper products | 7 334 | -22.4 | 1 362 | -17.6 |
| 19-21 Refined petro., chemicals, pharmac. | 23 478 | -3.9 | 4 487 | -13.7 |
| 22-23 Rubber, plastic and mineral prod. | 4 657 | 0.2 | 1 549 | -3.5 |
| 24 Basic metals | 29 631 | -0.2 | 6 831 | -4.7 |
| 13-15,18,25-33 Manufacturing n.e.c. | 3 186 | -3.0 | 1 742 | -14.6 |
Total energy costs amounted to just under NOK 20 billion; a decrease of 8,3 per cent.
The reduction in energy use can be explained by closures and temporary shutdowns of several large companies in power intensive industries during 2012. The power intensive industries account for around 80 per cent of the total power consumption and around 70 percent of total energy consumption in manufacturing. The biggest reduction can be seen in the manufacture of pulp and paper, and basic chemicals. The total energy use for these two industries decreased by 2.7 TWh or 11 per cent from 2011 to 2012. The power consumption for all industries in manufacturing decreased by 1.2 per cent to 43 101 GWh in 2012, the consumption of gas decreased by 3 per cent to 5 506 GWh and the consumption of self-produced bio energy decreased by 26,2 per cent to 3 837 GWh.
Lower electricity prices in 2012
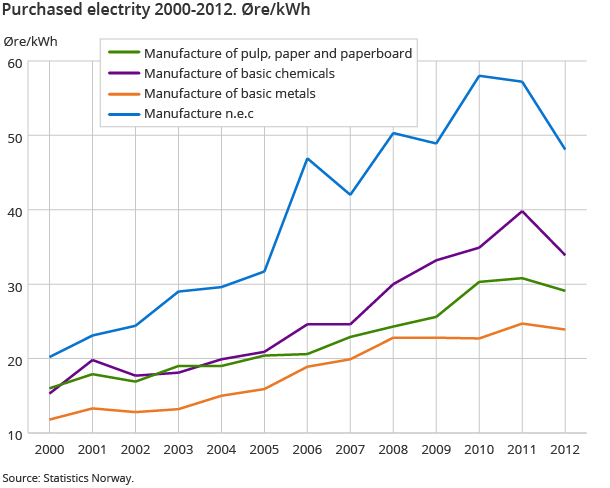
The clear decline in total energy costs can be explained by lower electricity prices in 2012 than in 2011. While the total energy costs were reduced by 8,3 per cent from 2011 to 2012, the electricity costs were reduced by 11 per cent and amounted to 13.3 billion in 2012. The electricity price for manufacturers of pulp and paper decreased by 5,8 per cent to 29.1 øre/ kWh, the price decreased by 14.8 per cent to 33.9 øre/ kWh for the manufacturers of basic chemicals and the electricity price for the manufacturers of basic metals decreased by 3.2 per cent to 23.9 øre/ kWh. The average price for other industries was 48.1 øre/kWh, a decrease of 15.9 per cent.
Coal and coke as a reducing agentOpen and readClose
Coal, coke etc. used as a reducing agent during production is regarded as fuel in the energy balance and is therefore included in the statistics from 2009. It is, for example, used in the production of basic metals. The costs related to the use of coal and coke as a reducing agent is included in the statistics from 2011.
Contact
-
Tove Helene Løvbak
E-mail: tove.lovbak@ssb.no
tel.: (+47) 40 02 08 94
-
Ingunn Ruud
E-mail: ingunn.ruud@ssb.no
tel.: (+47) 48 99 65 63


