Content
Published:
This is an archived release.
Increase in energy use and costs
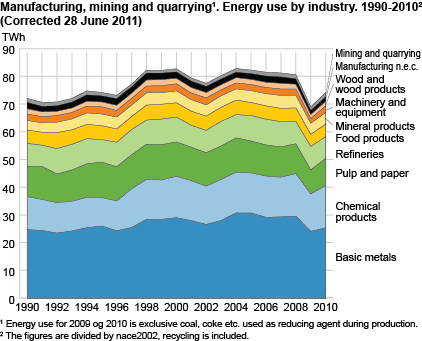
Total energy use in manufacturing, mining and quarrying amounted to 80 020 GWh in 2010; an increase of 9 per cent from the previous year. Total energy costs amounted to NOK 19 096 million; an increase of 18 per cent from 2009.
Corrected 28 June 2011 at 10.00 a.m.The figures for coal and coke used as a reducing agent were incorrect. Total figures were by consequence affected. The figures have been corrected and the text, tabeles and figures have been republished with new figures. |
As a result of the financial crisis, most of the industries within the manufacturing sector had a decrease in energy use in 2009. According to Statistics Norway's index of production, http://www.ssb.no/english/subjects/08/04/pii_en/arkiv/ , the output in the manufacturing sector has gradually increased since the summer of 2009, and was 2 per cent higher in 2010. The increase in the production activities in the manufacturing industries is mainly due to an increase in the output of basic chemicals, metals and wood and paper products. This is reflected in increased energy consumption in 2010, but we have to go back to the mid 90s to find the corresponding low energy (excluding coal and coke used as a reducing agent) to 2010. Energy intensity, measured by energy consumption divided by production value in constant 2000 prices, has fallen for Norwegian industry since 2002. Changes within industrial composition and prioritisation of energy efficient production methods are some of the reasons for this development. The total energy costs for 2010 increased by 18 per cent from 2009. This is mainly due to increased costs related to the purchase of gas and petroleum products.
Electricity
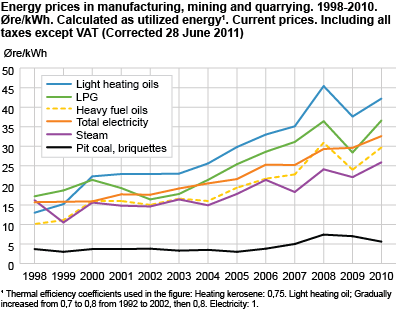
Electricity continues to be the dominant energy source in manufacturing, mining and quarrying, with 59 per cent of total energy use. Purchased amount of electricity increased by 7 per cent from 2009 to 2010 and the average electricity price for the whole sector increased by 10 per cent, from 29.61 cents/kWh to 32.59 cents/kWh. The basic metals industry has the highest consumption of electricity, with 54 per cent of the total. It also has the lowest electricity prices in 2010 with 22.88 cents/kWh. The average price is unchanged from 2009, suggesting that it continues to buy electricity through competitive electricity contracts. For other power-intensive industries such as wood processing and production of chemical raw materials, however, the average price increased by 17 per cent and 6 per cent respectively from 2009 to 2010.
Increased gas and petroleum prices
Purchased petroleum products for stationary use increased by 15 per cent, with an accompanying cost increase of 24 per cent from 2009. The average price of light heating oil increased by 11 per cent to NOK 6 306 per tonne in 2010, while the average price of heavy fuel oils increased by 19 per cent to NOK 3 718 per tonne. The average price of natural gas increased by 8 per cent to NOK 2 027 per 1 000 Sm3. Similarly, the average price of liquefied butane and propane (LPG) rose by 23 per cent to NOK 4 758 per tonne. It should be noted that the LPG price varies greatly with the quantity bought. This gives large price differences between the various industries.
Important announcementCoal, coke etc. used as a reducing agent during production is regarded as fuel in the energy balance and is therefore included in the statistics from 2009. The use of coal and coke as a reducing agent during production was 6,5 TWh; an increase of 27 per cent from 2009. |
Tables (Corrected 28 June 2011)
- Table 1 Energy consumption in establishments in maufacturing, mining and quarrying. Overview. Preliminary figures 2010
- Table 2 Energy consumption in establishments in manufacturing, mining and quarrying, by industry subclass and energy type measured in GWH. Preliminary figures 2010
- Table 3 Energy costs in establishments in manufacturing, mining and quarrying, by industry subclass and energy type. Preliminary figures 2010
- Table 4 Energy prices in establishments in manufacturing, mining and quarrying, by industry subclass and energy type measured in øre per kWh. Preliminary figures 2010
- Table 5 Energy consumption in establishments in maufacturing, mining and quarrying. Overview. Final figures 2009
- Table 6 Energy consumption in establishments in manufacturing, mining and quarrying, by industry subclass and energy type measured in GWH. Final figures 2009
- Table 7 Energy costs in establishments in manufacturing, mining and quarrying, by industry subclass and energy type. Final figures 2009
- Table 8 Energy prices in establishments in manufacturing, mining and quarrying, by industry subclass and energy type measured in øre per kWh. Final figures 2009
Contact
-
Tove Helene Løvbak
E-mail: tove.lovbak@ssb.no
tel.: (+47) 40 02 08 94
-
Ingunn Ruud
E-mail: ingunn.ruud@ssb.no
tel.: (+47) 48 99 65 63


