Content
Published:
This is an archived release.
Increased consumption of district heating and district cooling
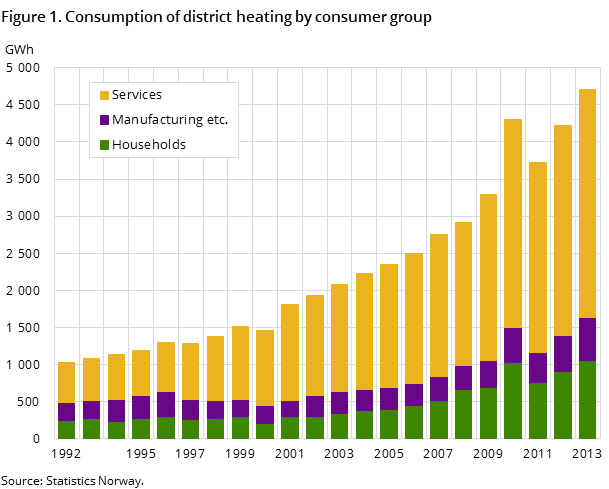
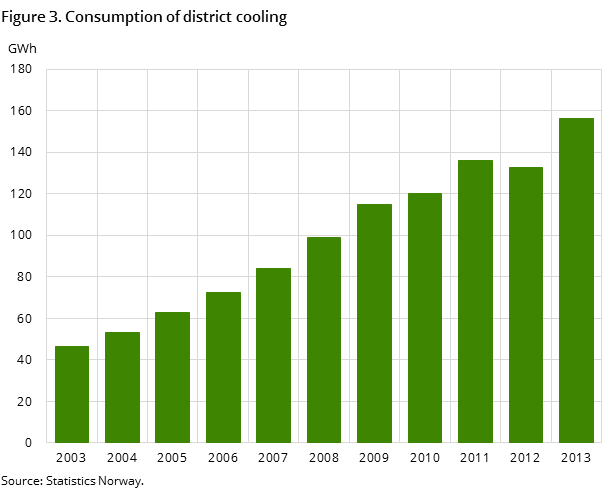
District heating consumption rose by 11.3 per cent from 2012 to 2013 and amounted to a record high of 4.701 GWh. Consumption of district cooling amounted to 1156.2 GWh; an increase of 17.6 per cent from the year before.
| 2013 | Share in per cent | Per cent change compared to last year | |
|---|---|---|---|
| District heating delivered to cunsumer (GWh) | 4 701 | 100.0 | 11.3 |
| ¬ Households | 1 054 | 22.4 | 15.4 |
| ¬ Manufacturing etc. | 581 | 12.4 | 20.5 |
| ¬ Services | 3 065 | 65.2 | 8.4 |
| Average price district heating (taxes excluded) (øre/kWh) | 59.2 | 4.6 | |
| Total investments (1 000 NOK) | 1 366 196 | -37.7 |


The increase is partly due to the start-up of new district heating and cooling plants and the expansion of existing plants. Increased consumption of district cooling can also be explained by the higher average temperature in 2013 compared to 2012. The average temperature in 2013 was 1.0 degrees above normal, while in 2012 it was 0.4 degrees above normal .
65 per cent of district heating consumption in service industries
Service industries continued to account for the largest share of consumption in 2013, and their use of district heating accounted for about 3.1 TWh . Twenty-two per cent of the total district heating consumption, or about 1.1 TWh, was delivered to households, while consumption in industry accounted for 12 per cent, or 582 GWh .
Waste most common in the production of district heating
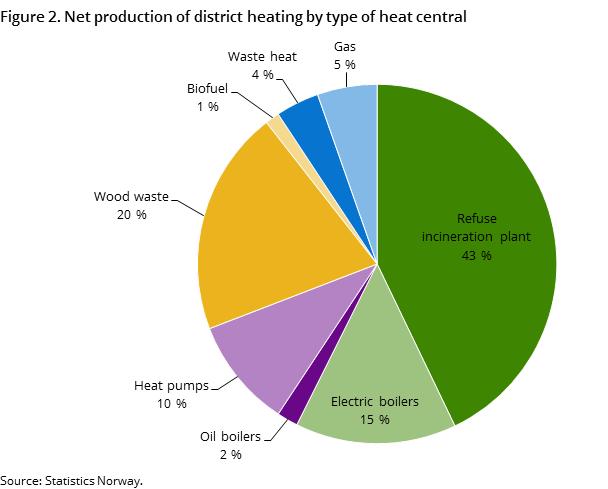
Waste incineration is the main energy source for district heating. In 2013, 43 per cent of district heating, or 2.3 TWh, was produced from waste. The second largest source of energy was waste wood facilities, with a share of around 20 per cent, which amounted to 1.1 TWh in 2013. The shares of district heating produced from electric, gas and oil boilers as well as waste heat decreased slightly compared with 2012, while the share of district heating from heat pumps has increased.
Increased sales revenues
The average price for district heating rose from 56.6 øre/kWh in 2012 to 59.2 øre/kWh in 2013. For households and the service sector, the average price was 59.8 and 61.5 øre/kWh respectively, while it was somewhat lower for industry, at 31.4 øre/kWh. The price for cooling was almost unchanged and amounted to 89.3 øre/kWh compared to 89.7 øre/kWh in the previous year.
Sales revenues for both district heating and cooling were higher in 2013 compared to 2012. The revenues from district heating sales rose by 15 per cent and amounted to NOK 2.7 billion. The corresponding increase for district cooling was 28 per cent to NOK 139 million.
1Corrected 04.11.2014
District cooling included in the statisticsOpen and readClose
Since 2013, the time series on consumption, sales incomes and average price of district cooling have been included in the statistics publication.
Contact
-
Ann Christin Bøeng
E-mail: ann.christin.boeng@ssb.no
tel.: (+47) 40 81 13 58
