Content
Published:
This is an archived release.
Increased consumption of district heating
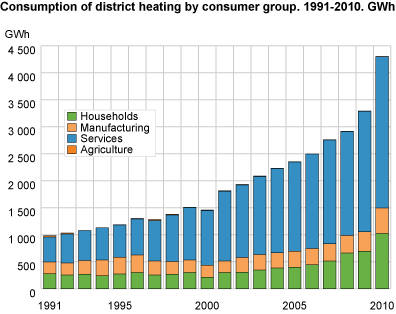
The consumption of district heating was 4.3 TWh in 2010; an increase of 31 per cent from 2009. High investments last year and the year before increase expectations of further growth in district heat consumption in the years ahead.
The sharp increase in district heating consumption may be seen in conjunction with a significant increase in production capacity and distribution capacity, both among established and newly-established district heating plants during the period. Also, the temperature was relatively low in 2010. In Norway as a whole, the average temperature was 2 degrees lower in 2010 compared with the year before.
The service industry had the largest share of district heat consumption in 2010. In total, 2.8 TWh was delivered to the industry in 2010. In the same period, household consumption totalled 1 TWh. The share of district heating consumption from manufacturing has been relatively constant the last couple of years. In 2010, consumption in manufacturing amounted to 470 GWh.
Even though district heat consumption is increasing, it only accounts for 1.6 per cent of the net domestic consumption of energy (see Preliminary energy balance ).
Record high investments
Total investments in district heating came to NOK 3.6 billion in 2010. This is 16 per cent higher compared with 2009, which was also a year with record high investment. The record high investments can be viewed in conjunction with Enova’s support schemes designed to encourage investment in district heating. Investments in production plants totalled NOK 2.5 billion in 2010, while investments in distribution amounted to NOK 1 billion. Other investments made up the rest of the investments.
High price and increased sales income
The price of district heating amounted to 65.1 øre/kWh in 2010, excluding VAT. This is an increase of 13 per cent compared to the year before. High prices and increased sales contributed to a significant increase in sales income in 2010. Compared to 2009, sales income increased by 46 per cent. In 2010, sales of district heating totalled NOK 2.7 billion.
| 2009 | 2010 | Change in per cent | |||||||||||||||||||||||||||||||||||||||||||||||||||||||||||||||||||||||||||||
|---|---|---|---|---|---|---|---|---|---|---|---|---|---|---|---|---|---|---|---|---|---|---|---|---|---|---|---|---|---|---|---|---|---|---|---|---|---|---|---|---|---|---|---|---|---|---|---|---|---|---|---|---|---|---|---|---|---|---|---|---|---|---|---|---|---|---|---|---|---|---|---|---|---|---|---|---|---|---|---|
| Total net production | 3 644 | 4 833 | 32.6 | ||||||||||||||||||||||||||||||||||||||||||||||||||||||||||||||||||||||||||||
| Refuse incineration plant | 1 313 | 1 564 | 19.1 | ||||||||||||||||||||||||||||||||||||||||||||||||||||||||||||||||||||||||||||
| Oil boilers | 251 | 684 | 171.9 | ||||||||||||||||||||||||||||||||||||||||||||||||||||||||||||||||||||||||||||
| Wood waste and bio fuel | 550 | 899 | 63.6 | ||||||||||||||||||||||||||||||||||||||||||||||||||||||||||||||||||||||||||||
| Electric boilers | 703 | 662 | -5.8 | ||||||||||||||||||||||||||||||||||||||||||||||||||||||||||||||||||||||||||||
| Heat pumps | 385 | 414 | 7.7 | ||||||||||||||||||||||||||||||||||||||||||||||||||||||||||||||||||||||||||||
| Gas | 270 | 402 | 49.3 | ||||||||||||||||||||||||||||||||||||||||||||||||||||||||||||||||||||||||||||
| Waste heat | 174 | 208 | 19.5 | ||||||||||||||||||||||||||||||||||||||||||||||||||||||||||||||||||||||||||||
High net production
The gross production of hot water and steam came to 5 536 GWh in 2010, of which 226 GWh was used in the production of electricity and 477 GWh was non-distributed heat, resulting in a net production of district heating of 4 833 GWh and losses in the distribution net of 533 GWh.
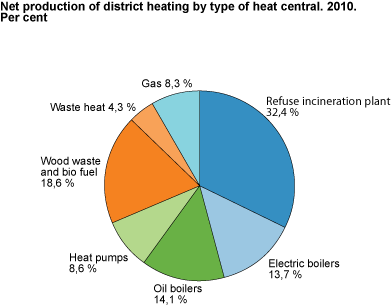
Even though the share of production from refuse incineration decreased by 3.6 per cent from 2009 to 2010, refuse incinerations remained the most important input factor in district heating production. Production from refuse incineration accounted for 32.4 per cent of net production of district heating in 2010. Both oil and electric boilers accounted for about 14 per cent of production in 2010. The share of oil boilers in production increased by 7.2 percentage points, while the share of electric boilers was reduced by 5.6 percentage points. This can be viewed in conjunction with higher electricity prices in 2010, which increased the costs associated with electric boilers in production (see Prices of electric energy ). The share of wood waste and bio fuel increased by 3.5 percentage points to 19 per cent in 2010, while gas, waste heat and heat pumps accounted for 8.3, 4.3 and 8.6 per cent respectively.
Tables:
Contact
-
Ann Christin Bøeng
E-mail: ann.christin.boeng@ssb.no
tel.: (+47) 40 81 13 58


