Higher electricity prices for households
Published:
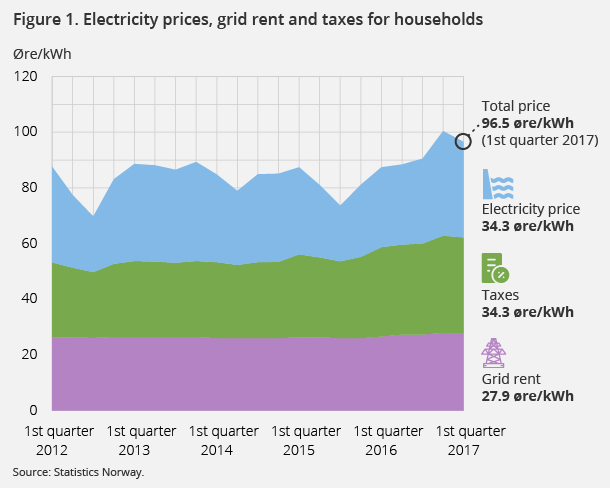
The average price of electricity for households, excluding taxes and grid rent, was 34.3 øre per Kwh in the first quarter of 2017. This is 20 per cent higher compared to the first quarter in 2016.
- Full set of figures
- Electricity prices
- Series archive
- Electricity prices (archive)
The overall price of electricity for households, including grid rent and taxes, was on average 96.5 øre per kWh in the first quarter of 2017. This is over 10 per cent higher compared to the first quarter in 2016. Of this, the price of electricity amounted to 34.3 øre per kWh, the grid rent 27.9 øre per kWh and taxes came to 34.3 øre per kWh.
According to the Norwegian Water Resources and Energy Directorate (NVE), one of the main reasons for the increase in electricity prices in the first quarter of 2017, compared with the previous year, is that the Norwegian reservoir filling rate was 9 percentage points lower during this period. In addition, increased coal prices have contributed to higher electricity prices on the continent, and this has also affected the Nordic price level.
Contracts with variable price were most expensive
Households with variable price contracts had the most expensive contract type in the first quarter of 2017, with an average electricity price of 39.6 øre per kWh, excluding taxes and grid rent. For households with contracts tied to the spot price, which is the most common type of contract, the average electricity price was 32.1 øre per kWh. Fixed-price contracts lasting than one year had the cheapest contract type in the first quarter of 2017, with an average electricity price of 29.6 øre / kWh. Few households get power through fixed-price contracts, and these contracts represent a very low proportion of total power consumption.
Figure 2. Price of electric energy for households, taxes and grid rent excluded
| New fixed price contracts – 1 year or less | 32 |
| New fixed price contracts – 1 year or more | 29.6 |
| All other fixed-price contracts | 30.2 |
| Contracts tied to spot price | 32.1 |
| Variable price (not tied tospot price) | 39.6 |
Figure 3. Distribution of contract types. 1st quarter 2017
| Fixed-price contracts | Contracts tied to spot price | Variable price contracts | |
| Households | 2.00 | 68.04 | 29.96 |
| Services | 4.83 | 90.42 | 4.74 |
| Manufacturing excl. energy-intensive manufacturin | 6.01 | 91.00 | 2.99 |
-
More tables and numbers about Electricity prices
Contact
-
Thomas Aanensen
-
Wiktor Olaisen
-
Statistics Norway's Information Centre

